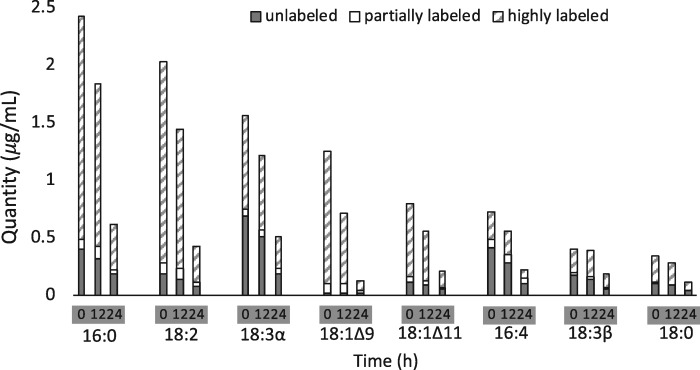
Figure 8.
13C-labeled and unlabeled FA content of TAG during N-resupply in timecourse B. Quantity of TAG FAs divided into low, intermediate, and high levels of 13C-acetate incorporation. Bars represent an average of three biological replicate cultures in experimental timecourse B (see Materials and Methods section). Error is not shown, although data ±SD in line graph form is shown in Supplemental Figure S2.

