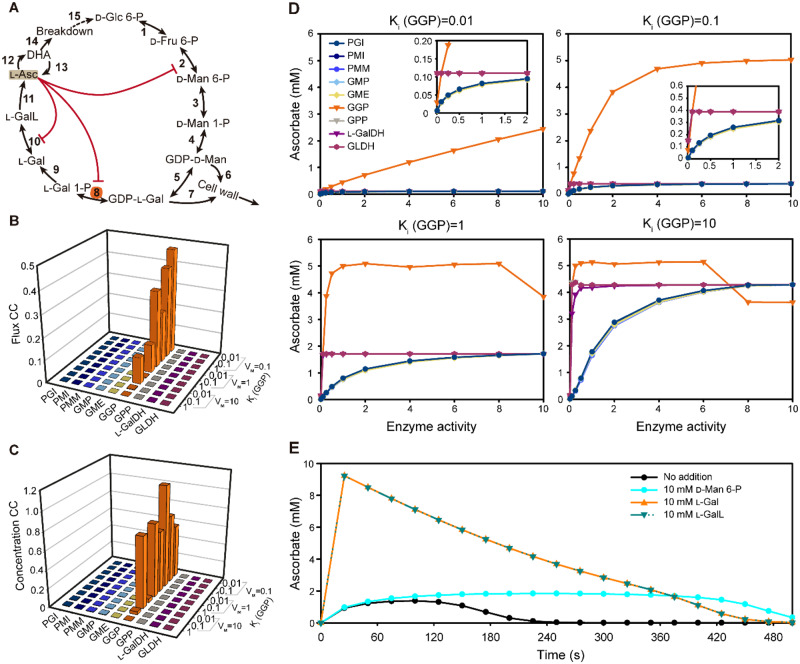
Figure 8.
A kinetic model of ascorbate biosynthesis and turnover. A, Scheme of the pathway modeled in COPASI showing intermediates catalytic steps (arrows) and feedback (red lines). The initial model parameters are shown in Supplementary Table S3. B, Metabolic control analysis at steady state was used to calculate flux control coefficients for each enzyme with various strengths of noncompetitive inhibition exerted by ascorbate (indicated by Ki values) on GGP (Step 8). C, Metabolic control analysis at steady state was used to calculate concentration control coefficients for ascorbate with various strengths of noncompetitive inhibition exerted by ascorbate (indicated by Ki values) on GGP (Step 8). D, The effect of varying enzyme activity on ascorbate concentration with various strengths of noncompetitive inhibition exerted by ascorbate (indicated by Ki values) on GGP (Step 8). E, Time course of the change in ascorbate concentration in response to the addition of D-mannose 6-phosphate (D-Man 6-P), L-galactose (L-Gal), and L-galactono-1,4-lactone (L-GalL). 1: PGI, 2: PMI, 3: PMM, 4: GMP, 5: GME, 6:GDP-D-mannose to cell wall polymers, 7: GDP-L-galactose to cell wall polymers, 8: GGP, 9: GPP, 10: L-GalDH, 11: GLDH, 12: Oxidation, 13: Reduction, 14: Turnover, and 15: Recycle.

