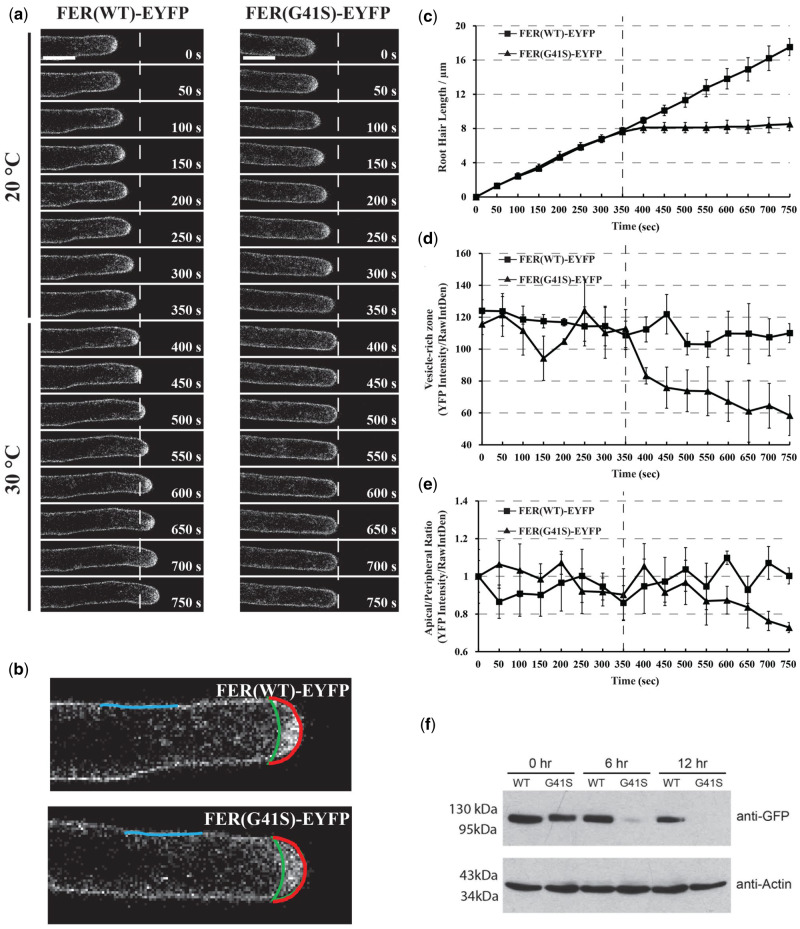
Figure 8.
Subcellular localization dynamics of FER(WT)-EYFP and FER(G41S)-EYFP proteins in growing root hair cells under both normal (20°C) and elevated (30°C) temperatures. (A) Root hair tip-growth in stably transformed lines expressing FER(WT)-EYFP and FER(G41S)-EYFP fluorescent fusion proteins under (20°C) and (30°C) temperature by time-lapse microscopy. Confocal images were acquired using a Leica confocal laser-scanning microscope SP8 with a 63× oil lens (Numerical Aperture = 1.4) with 5 s intervals. Representative images are presented at 50 s intervals (10 frames). Scale bar: 10 µm. (B) Schematic diagram showing areas and lines used for fluorescence intensity quantification. Apical (red line) and peripheral (blue line) plasma membrane domains were measured, and the area between the apical plasma membrane and green line represents the vesicle-rich zone. (C) Quantitative analysis of root hair growth in stably transformed lines expressing FER(WT)-EYFP (n = 3) and FER(G41S)-EYFP (n = 3). Root hair elongation was measured every 50 s using the measurement function in ImageJ. (D) Quantitative analysis of YFP intensity of the vesicle-rich zone. (E) Quantitative analysis of YFP intensity of the apical/peripheral ratio. Values are normalized using 0 s as 100%. The dashed line indicates the time point of transition from permissive (20°C) to (30°C). Error bars in (C–E) represent sd. (F) Protein turnover rates of FER(WT)-EYFP and FER(G41S)-EYFP at elevated temperature (30°C). Five-day-old seedlings were grown at 20°C and then treated with 200 µM cycloheximide and transferred to 30°C. Total proteins were extracted at each time point and the relative levels were determined using immunoblotting with anti-GFP and anti-actin antibodies. FER(G41S)-EYFP levels rapidly decreased during the time course, while levels of FER(WT)-EYFP were not significantly reduced. Actin was used as a loading control.

