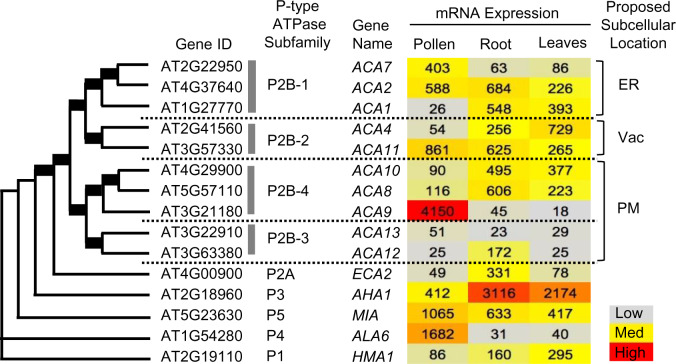
Figure 1.
Similarity tree showing four distinct subfamilies of ACA-type Ca2+ P-type ATPases. The similarity tree was obtained from Pollen RCN (http://arabidopsis-heat-tree.org/) using full-length protein sequences of all 10 members of P2B ATPases with one representative member from each of the other P-type ATPases (P1, P2A, P3, P4, P5). Bold lines in tree branches indicate boot-strap values of 100. Heat map showing gene expression profiles in pollen, root, and leaves based on microarray experiments values from (http://arabidopsis-heat-tree.org/). A more complete expression profile comparison with all P-type ATPases is provided in Supplemental Table S1, along with a comparison with two RNA-seq data sets. ER, endoplasmic reticulum; Vac, vacuole; PM, plasma membrane.

