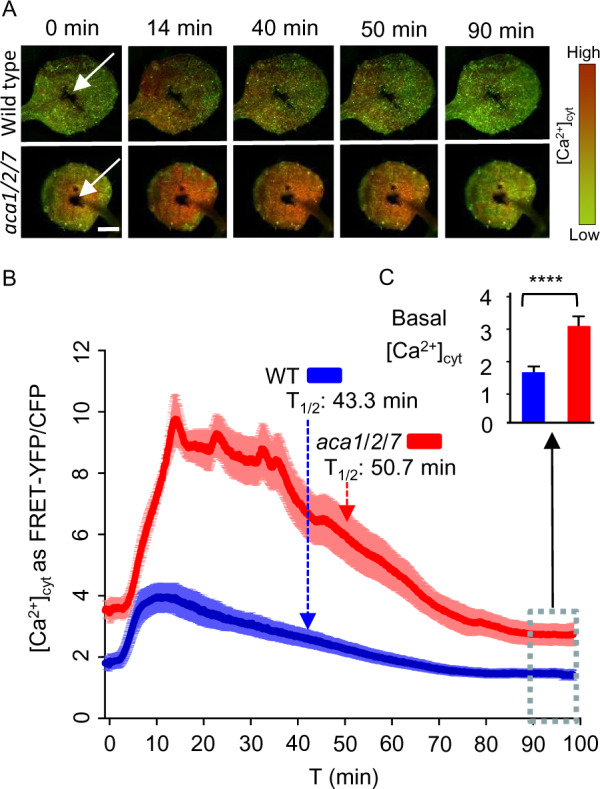
Figure 10.

FRET imaging of YC-Nano65 showing WT and aca1/2/7 seedlings differ in Ca2+ dynamics triggered by a pathogen elicitor. Flg22 pathogen elicitor-triggered [Ca2+]cyt changes were monitored using a YC-Nano65 reporter stably expressed in WT and an aca1/2/7 mutant. Analyses shown were conducted using the first true leaves from 2-week-old seedlings. On the day before imaging, a wound site (white arrows, Panel A) was created with a tweezer tip. The wound site was created to permit the direct infiltration of an elicitor solution into surrounding cells. Immediately prior to imaging, seedlings were allowed to adapt to a continuous blue-light exposure (ex440/40 nm with 24 µmol m−2s−1 intensity) for at least 1 h. After application of 500 nM flg22 elicitor (in 2 µL), images were captured every 2 s for 100 min. A, Representative images showing a time series of FRET–YFP/CFP ratios in leaves from WT and aca1/2/7 after exposure to flg22. Indicated time (min) correspond to points graphed in panel “B” to show the time course of [Ca2+]cyt changes. Scale bar is 0.5 mm. B, Graph showing quantitative ratio of [Ca2+]cyt changes for WT (blue) and aca1/2/7 (red) in response to flg22 applied at time zero. Ratiometric data from the FRET–YFP/CFP signals were extracted from the entire leaf surface. Error bars are sem from n = 8 independent seedlings. Dashed lines with arrows mark the half time of [Ca2+]cyt decay from the peak to basal levels. C, Average basal [Ca2+]cyt levels after a recovery from a flg22 elicitor-triggered [Ca2+] signature. The basal levels were calculated by averaging ratio data from the 90–100 min time period (blue dashed line box, total 300 time points each) in “B”. Error bars are sem from n = 2400 measurements each for aca1/2/7 or WT based on an analysis on eight independent seedlings. Statistical analysis was done using Student’s t test. ****indicates P < 0.0001. Plant lines used and corresponding ss numbers are the same as identified in Figure 9.
