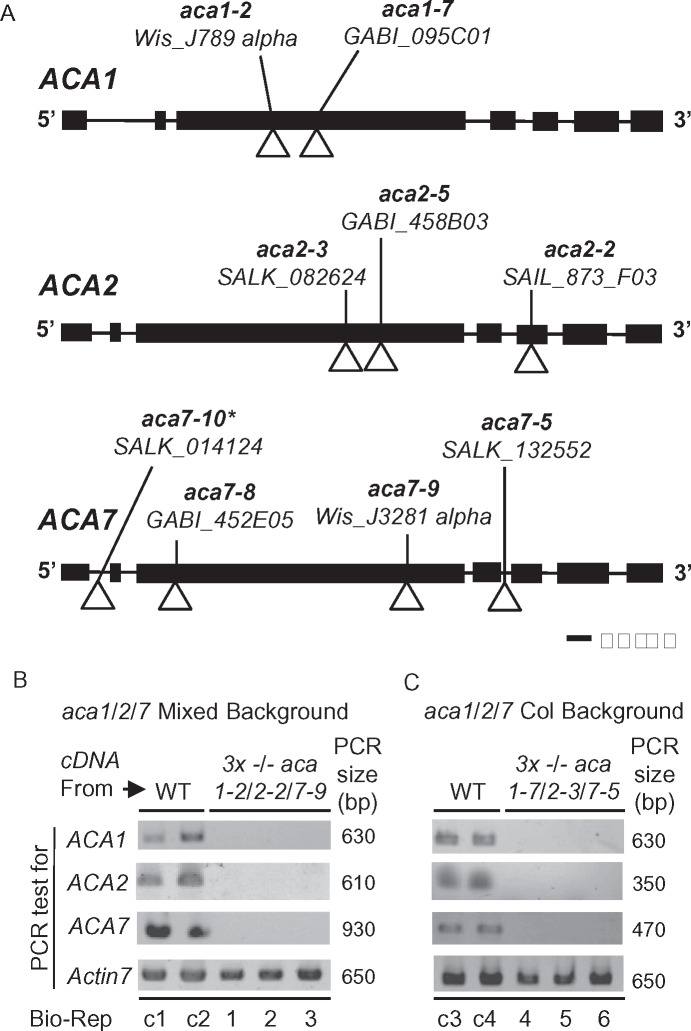
Figure 5.
Positions of T-DNA disruptions in gene models for ACA1, 2, and 7. A, Gene diagrams for ACA1 (At1g27770), ACA2 (At4g37640), and ACA7 (At2g22950) are shown. The allele name, source, and position of T-DNA insertions are shown. Exons and introns are depicted by boxes and lines, respectively. *aca7-10 is derived from the same source plant as aca7-1 in (Lucca and León, 2012). B and C, Qualitative PCR showing the presence or absence of detectable mRNA for ACA1, 2, and 7 in WT or KO mutants. Two biological replicates (Bio-Reps) are shown for mRNA from WT background controls, WS (control c1 and c2), and Col (c3 and c4). For each KO, 3 biological replicates all show a failure to amplify each ACA mRNAs in KO mutants aca1-2/2-2/7-9 (“Mixed Background”) Bio-Reps 1, 2, and 3 (Panel B) and aca1-7/2-3/7-5 (Col Background) Bio-Reps 4, 5, 6 (Panel C). PCR amplification of Actin 7 (At5g09810) was used as a normalization control (650 bp fragment generated with primers 2297a + 2297br). For ACAs, primers with expected amplicon sizes (PCR size in bp) were ACA1 (630 bp) primers 2308a + 2308br, ACA2 (610 bp) primers 2304a + 2304br or (350 bp) primers 2307a + 2306br, ACA7 (930 bp) primers 875e + 2292 or (470 bp) primers 875g + 2292. The cDNA used was made from equivalent mixtures of mRNA from leaf and pollen tissue. Primer positions and sequences used for genotyping and qualitative PCR analyses are provided in Supplemental Figure S3 and Supplemental Table S2, respectively.

