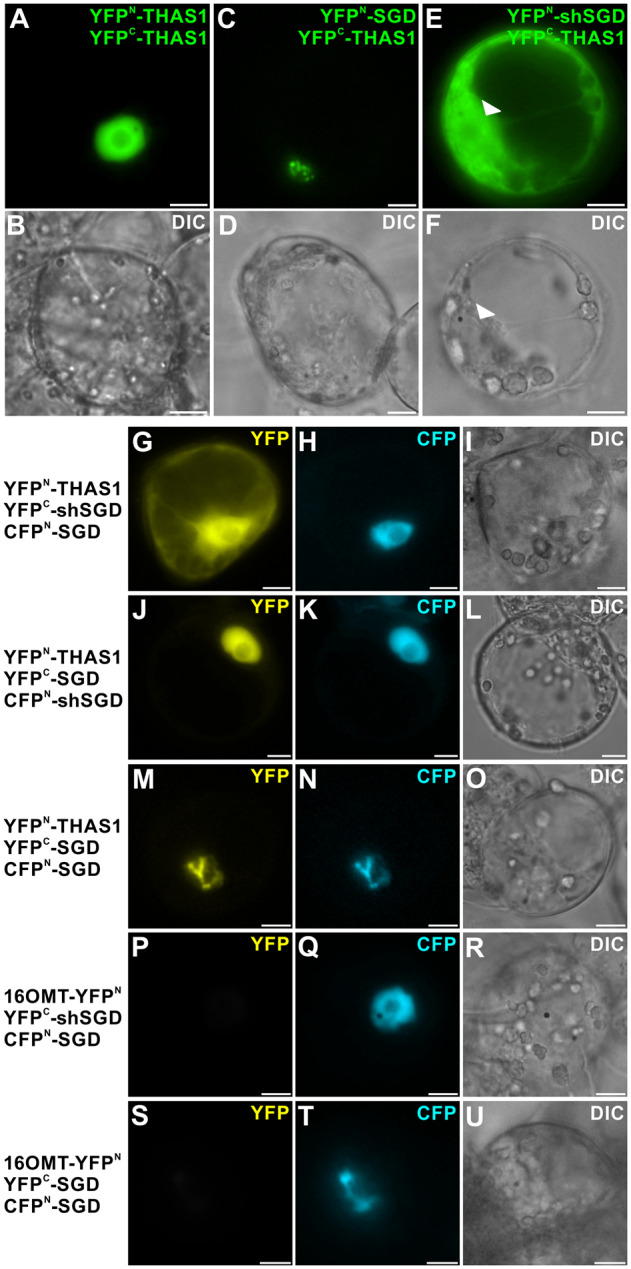
Figure 10.

shSGD/THAS1 interaction causes partial delocalization of THAS1 to the cytosol and impacts the distribution of SGD/THAS1 complexes. A and B, THAS1 self-interactions; C and D, SGD/THAS1; and E and F, shSGD/THAS1 interactions were analyzed by BiFC in C. roseus cells transiently transformed by appropriated combinations of plasmids encoding fusions with the two split YFP fragments, as indicated on the right of each fluorescence picture. Arrowheads label cell nucleus. G–O, C. roseus cells were transiently co-transformed by the combinations of plasmids described on the left margin, expressing THAS1, shSGD, or SGD fused to split YFP fragment (YFPN and YFPC) and SGD or shSGD fused to a split CFP fragment (CFPN-SGD). P–R, 16-Hydroxytabersonine 16OMT/SGD/shSGD self-interactions and S–U, 16OMT/SGD/SGD interactions were studied to evaluate the specificity of THAS1/SGD and THAS1/shSGD interactions. Association of the two split YFP fragments results in the emission of a yellow fluorescent signal (G, J, and M), whereas association of split CFPN and split YFPC (H, K, N, Q, and T) allows the emission of a blue fluorescent signal. Cell morphology is observed with differential interference contrast (DIC) (B, D, F, I, L, O, R, and U). Bars, 10 µm.
