Figure 9.
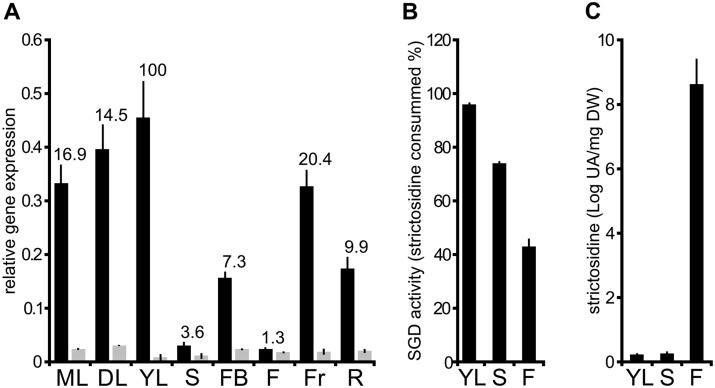
In planta correlation of shSGD and SGD transcript amounts, SGD activity, and strictosidine accumulation. A, Relative quantification of SGD (dark) and shSGD (gray) transcripts in different C. roseus organs including mature leaves (ML), developing leaves (DL), young leaves (YL), stems (S), flower buds (FB), flowers (F), fruits (Fr), and roots (R). RNAs were extracted from organs and reverse-transcribed before determination of gene expression by qPCR. Transcript copy numbers were normalized using CrRPS9. Values correspond to SGD/shSGD rations in the different organ types. B, SGD activity was measured in YL, S, and F by incubating 15 µg of each crude protein extract with 50 µM strictosidine for 30 min. SGD activity is expressed as the percent of consumed strictosidine. C, Quantification of in planta strictosidine in YL, S, and F. For all experiments in G, H, and I, assays were performed in triplicate, and expression measurements were performed at least twice with independent experimental replicates.

