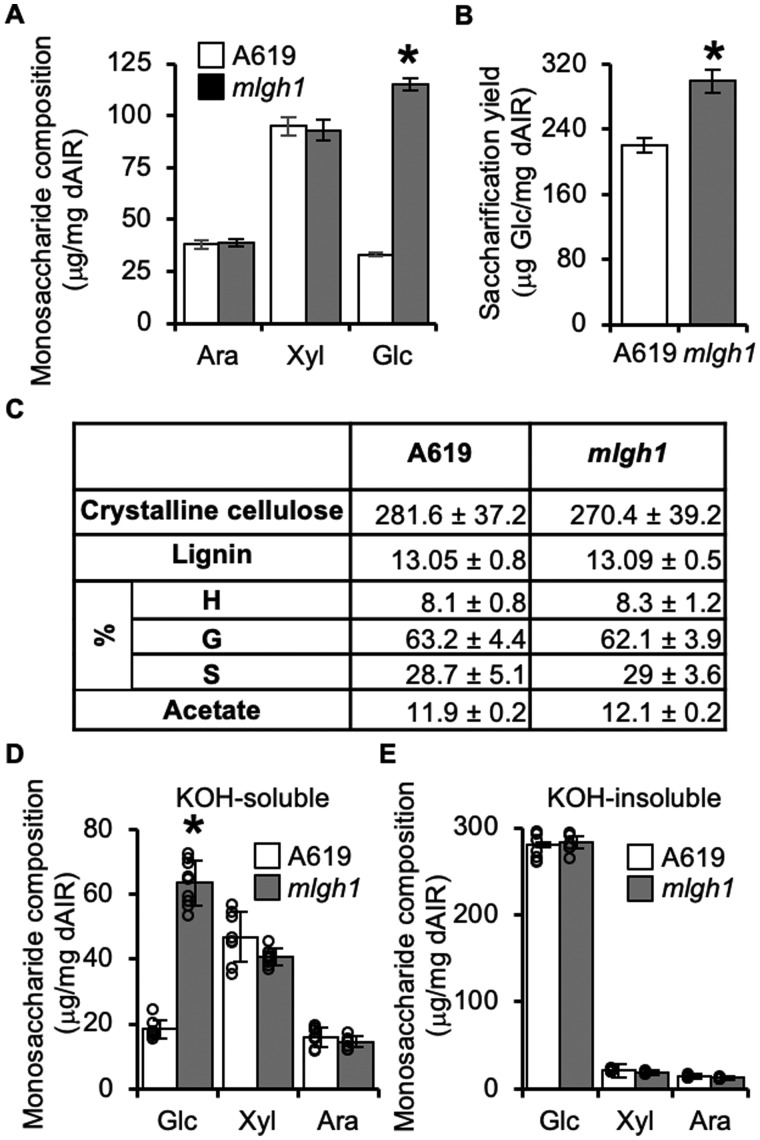
Figure 1.
Cell wall composition of the maize mlgh1 mutant. A, High performance anion exchange chromatography (HPAEC)-based quantification of monosaccharides released by acid hydrolysis. B, Glucose (Glc) released by enzymatic digestion of dAIR. C, Table summarizing the content in A619 and mlgh1 in terms of crystalline cellulose (mg/mg dAIR), lignin content (% of acetyl bromide soluble lignin) and lignin composition (%), and wall-bound O-acetate (mg/mg dAIR). (%) means lignin composition as the distribution of guaiacyl (G), p-hydroxyl phenol (H), and syringyl (S) monolignols. No significant differences were found between genotypes (Student’s t test, P < 0.05). D and E, HPAEC-based quantification of the monosaccharides present in KOH-soluble (D) and KOH-insoluble (E) fractions. All bar diagrams represent the mean ± standard deviation of four biological replicates. A619 (white bars) and mlgh1 (gray bars). Asterisks indicate statistical difference between the two genotypes according to Student’s t test (P < 0.05). Ara, Arabinose; Xyl, Xylose; and Glc, Glucose.

