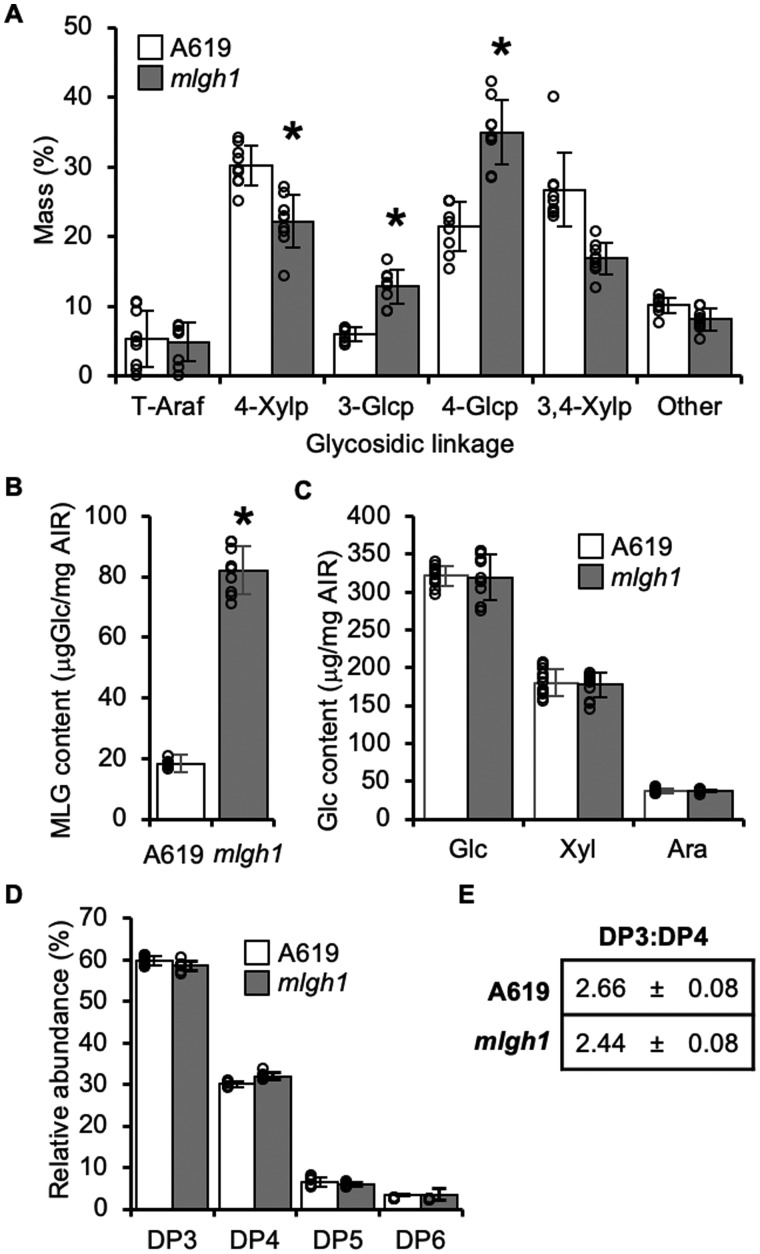
Figure 2.
MLG content and structure in mlgh1. A, Glycosidic linkage analysis of released oligosaccharides after licheninase treatment of AIR. Values represent the percentage of the total ion chromatogram peak area of the indicated partially methylated, acetylated alditols. t-Araf = terminal arabinofuranosyl; 4-Xylp = 4-linked xylopyranosyl; 3-Glcp = 3-linked glucopyranosyl; 4-Glcp = 4-linked glucopyranosyl; 3,4-Xylp = 3,4-linked xylopyranosyl. B, MLG content measured as glucose (Glc) released after licheninase digestion of AIR, followed by glucosidase treatment of the resulting (1,3;1,4) β‐glucan oligosaccharides. C, Glc content released by Saeman hydrolysis of the insoluble residue left after licheninase treatment in (B). Ara: Arabinose; Xyl: Xylose; Glc: Glucose. D, High performance anion exchange chromatography (HPAEC)-based quantification of (1,3;1,4) β‐glucan oligosaccharide products released by licheninase treatment of AIR. DP = DP of detected hexose oligomers. E, Molar ratio of cellotriosyl:cellotetraosyl units of MLG (DP3:DP4) in A619 and mlgh1. Data represents mean ± sd. All bar diagrams represent the mean ± standard deviation of n > 5 biological replicates. A619 (white bars) and mlgh1 (gray bars). Asterisks indicate statistical difference between the two genotypes according to Student’s t test (P < 0.05).

