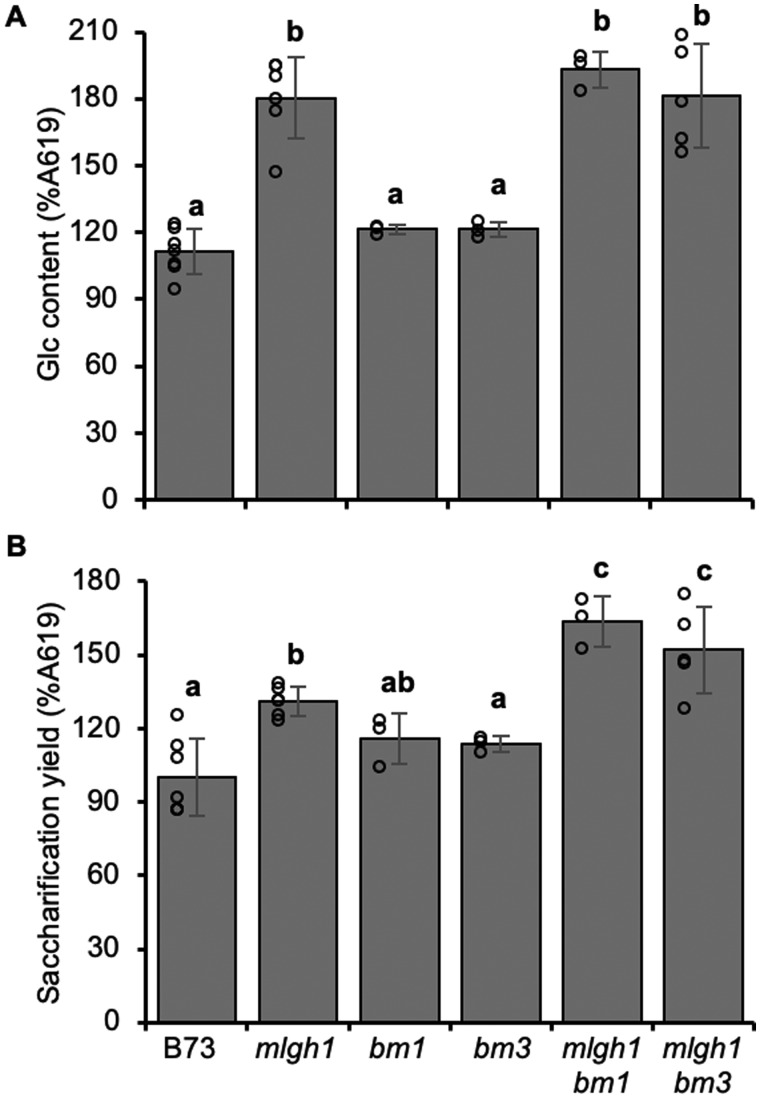
Figure 3.
Effect of altered lignin on mlgh1 phenotype. A, Glucose (Glc) content of the hemicellulosic wall fraction (acid hydrolysis). B, Glc released by enzymatic digestion of dAIR. All bar diagrams represent the mean ± sd of n ≥ 3 biological replicates. Different letters indicate statistical differences based on ANOVA with post-hoc Tukey Honest Significance Difference test (Significant P < 0.05).

