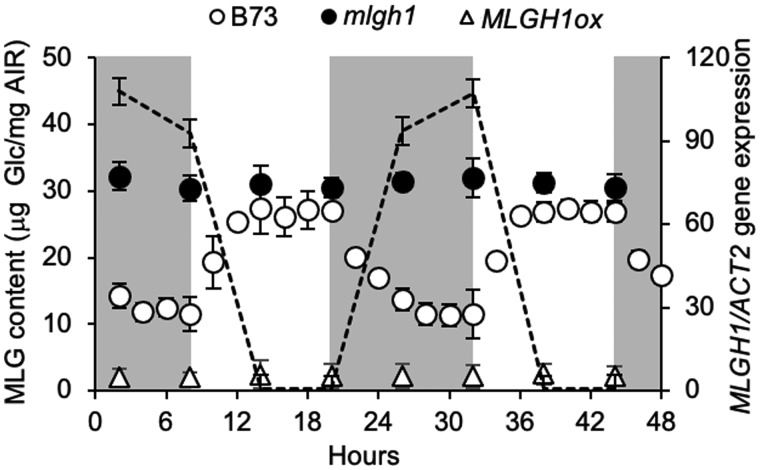
Figure 6.
Time course of MLGH1 gene expression and MLG content. Left axis shows MLG content measured as glucose (Glc) released after licheninase digestion of AIR followed by glucosidase treatment of the resulting (1,3;1,4) β‐glucan oligosaccharides. Wild-type (B73, empty circles), mlgh1-1 mutant (black circles) and MLGH1ox (empty triangles) values shown as mean ± sd of five biological replicates. Dashed line shows the MLGH1 gene expression in B73 measured by RT-qPCR (right axis) as mean ± sd of three biological replicates. Actin2 (ACT2) gene expression was used for normalization. Samples for both analyses were taken at the indicated time points. Gray/white areas indicate subjective night and day, respectively.

