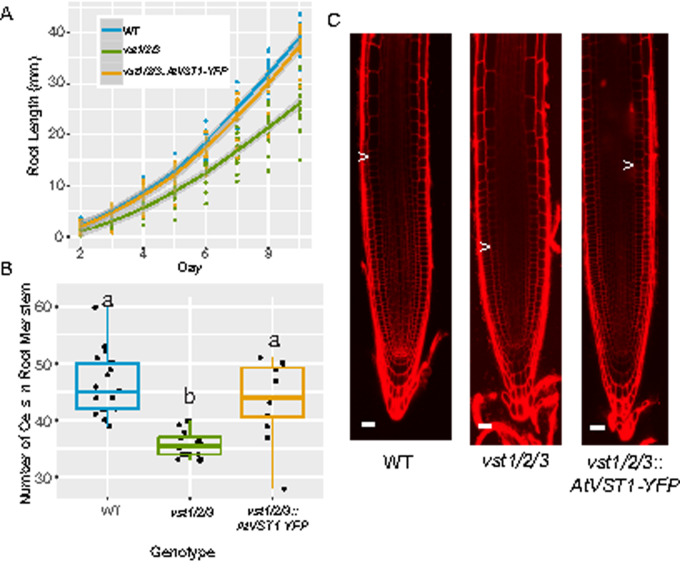
Figure 5.
The reduced root length and meristem size in Arabidopsis vst1/2/3 triple mutants is rescued by expression of AtVST1. (A) Timecourse of growth of Arabidopsis roots on agar plates (n = 16–19 plants). Line is fitted with the “geom_smooth” function in ggplot2 using the method “loess.” (B) Quantification of root meristem cell number (n = 12–21 plants) and (C) representative confocal images of 7-d-old Arabidopsis roots. Arrow indicates location of junction of meristem and elongation zone. In boxplots, median is represented by horizontal line in the boxplot, box ranges represent quartiles 1 and 3, lines indicate points within 1.5 times the interquartile range. Points beyond lines are considered outliers. Significantly different values are indicated by different letters (P < 0.05; one-way ANOVA with Tukey’s test). Bars = 25 μm.

