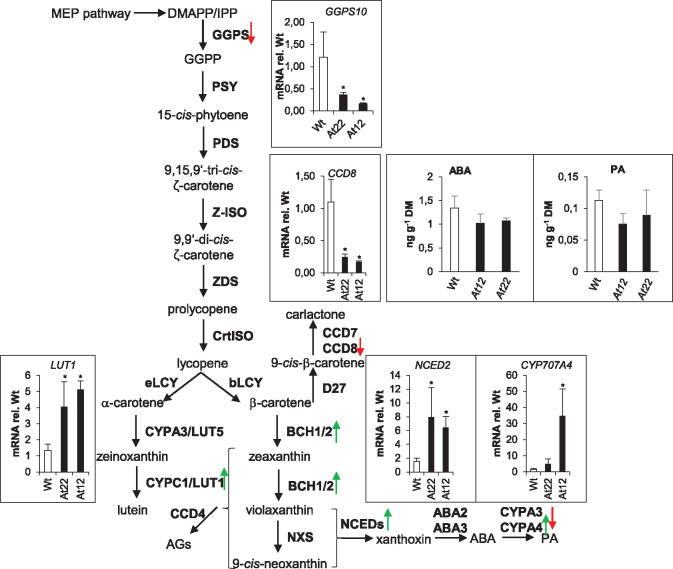
Figure 3.
Transcript response of carotenogenic enzymes to β-carotene and β-apocarotenoid accumulation. Enzymes (in bold) and intermediates of carotenoid biosynthetic pathway. Trends of expression changes in response to increased β-carotene and apocarotenoid formation achieved through PSY-overexpression are marked with green (induction) and red (repression) arrows. Absence of arrow indicates unchanged expression levels (FDR cutoff = 0.05; at least 2-fold differences). Inset diagrams show transcript levels of selected genes in two lines (At22, At12) relative to wild-type levels, determined by RT-qPCR. ABA and PA levels were determined by LC–MS from wild-type, At12 and At22 roots. Results are mean ± sd from at least three biological replicates. Significant difference to the WT, Student’s t test, *P <0.05. eLCY, ε-cyclase; bLCY, β-cyclase; LUT5, cytP450 hydroxylase 97A3; LUT1, cytP450 hydroxylase 97C1; BCH1/2, β-carotene hydroxylase 1/2; NXS, neoxanthin synthase; NCED, 9-cis-epoxycarotenoid dioxygenase; D27, β-carotene isomerase; ABA 2/3, short-chain dehydrogenase/reductase, CYPA3/A4, ABA hydroxylase.

