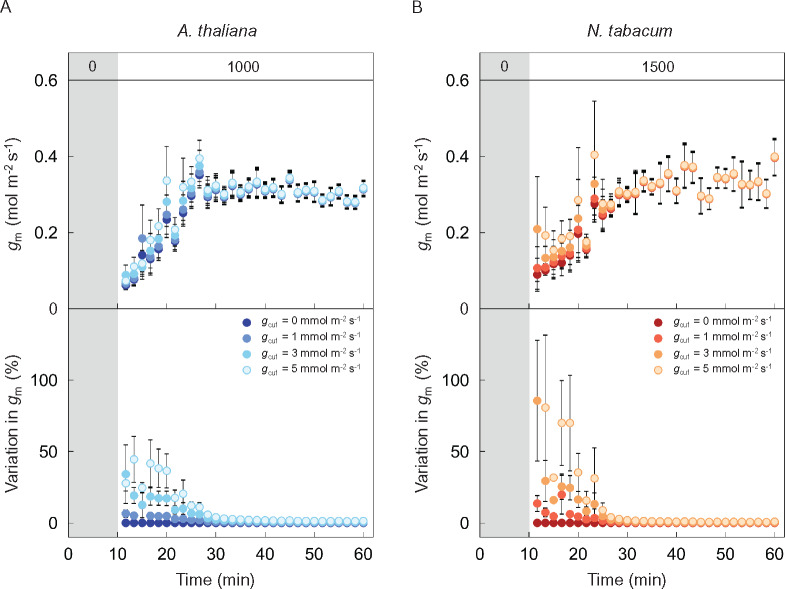
Figure 2.
Effects of cuticular conductance on estimated mesophyll conductance values. Variation in mesophyll conductance (gm) was calculated assuming a cuticular conductance (gcut) of 0 (dark), 1 (slightly dark), 3 (slightly pale), or 5 (pale) mmol m−2 s−1 in (A) Arabidopsis (blue) and (B) tobacco (red), respectively, with the dataset shown in Figure 1, A and C. The vertical bars on each plot indicate the standard error with 6–8 replicate leaves for Arabidopsis and 3–6 leaves for tobacco. Grey boxes in each figure indicate the initial period of darkness. The numbers (0, 1,000, and 1,500) in grey and white boxes at the top of (A) and (B) indicate the light intensity.

