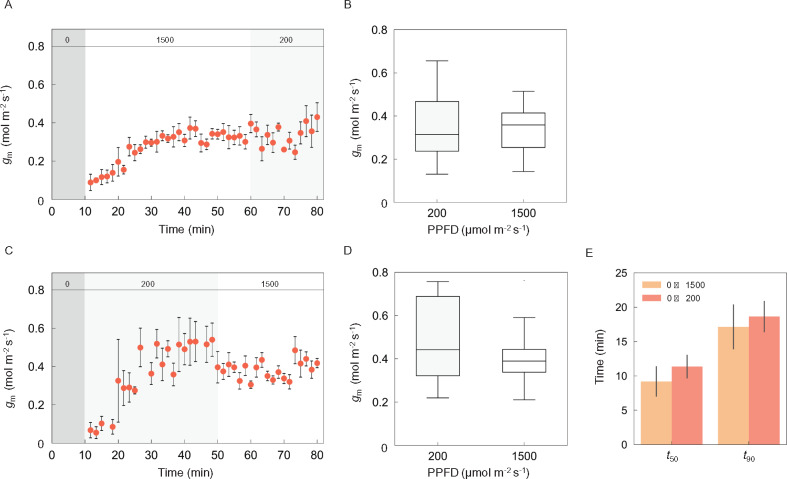
Figure 5.
Responses of mesophyll conductance following transitions to low and high light for tobacco. Mesophyll conductance (gm) was measured every 100 s under the light sequence (A) from darkness (10 min) to a PPFD of 1,500 (50 min) then 200 (20 min) or (C) from darkness (10 min) to 200 (40 min) then 1,500-µmol photons m−2 s−1 (30 min). CO2 concentration and air temperature in the chamber were set to 400 µmol mol−1 and 24°C, respectively. Grey and pale-grey boxes in each figure represent the periods of darkness and 200-µmol photons m−2 s−1, respectively. The numbers (0, 200, and 1,500) in the grey, pale-grey, and white boxes at the top of (A) and (C) indicate the light intensity. The variation in gm under steady state was compared between the light intensity of a PPFD of 200 (pale-grey) and 1,500 (white)-µmol photons m−2 s−1 under the light sequence (B) from darkness (10 min) to 1,500 (50 min) then 200 (20 min) or (D) from darkness (10 min) to 200 (40 min) then 1,500-µmol photons m−2 s−1 (30 min). (E) The time taken for gm to reach 50% (t50) and 90% (t90) of their maximum value was compared between two light sequences. The vertical bars on each plot and columns in (A), (C), and € indicate the standard error with 3–6 replicate leaves for tobacco.

