Figure 6.
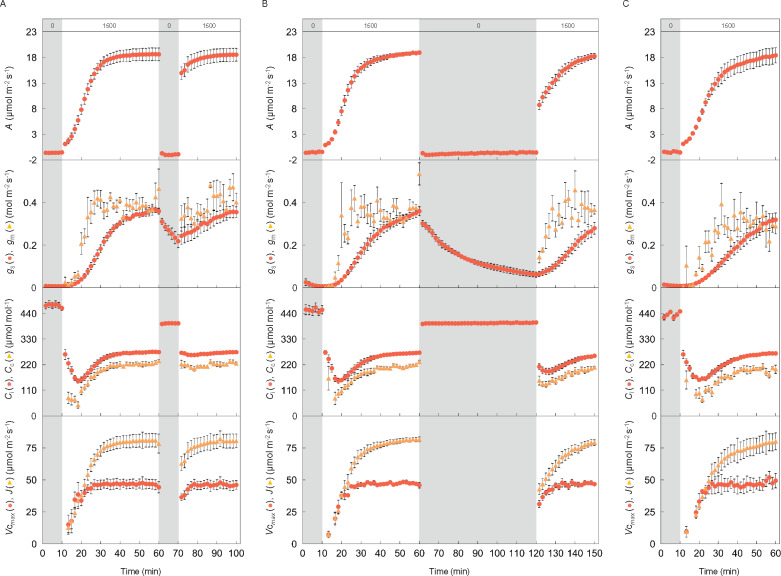
Responses of CO2 assimilation rate, stomatal and mesophyll conductance, CO2 concentration in intercellular airspaces and chloroplast stroma, the maximum rate of RuBP carboxylation, and electron transport after short or long periods of darkness. CO2 assimilation rate (A), stomatal (gs; dark circle), and mesophyll conductance (gm; pale triangle) to CO2, and CO2 concentration in the intercellular airspaces (Ci; dark circle) and chloroplast stroma (Cc; pale triangle) were measured every 100 s under the light condition of (A) a PPFD of 0, 1,500, 0, and 1,500-μmol photons m−2 s−1 for 10, 50, 10, and 30 min, and (B) 0, 1,500, 0, and 1,500-μmol photons m−2 s−1 for 10, 50, 60, and 30 min preceded by overnight-darkness, or (C) 2 h of sunlight followed by 5 h of darkness, then 0 and 1,500-μmol photons m−2 s−1 for 10 and 50 min, respectively. The maximum rate of RuBP carboxylation (Vcmax; dark circle) and electron transport (J; pale triangle) were also estimated assuming RuBP-carboxylation or RuBP-regeneration limiting conditions. CO2 concentration and air temperature in the chamber were set to 400 µmol mol−1 and 24°C, respectively. The vertical bars on each plot indicate the standard error with 3–6 replicate leaves for tobacco. Grey boxes in each figure represent the periods of darkness. The numbers (0 and 1,500) in the grey and white boxes at the top of (A), (B), and (C) indicate the light intensity.

