Figure 1.
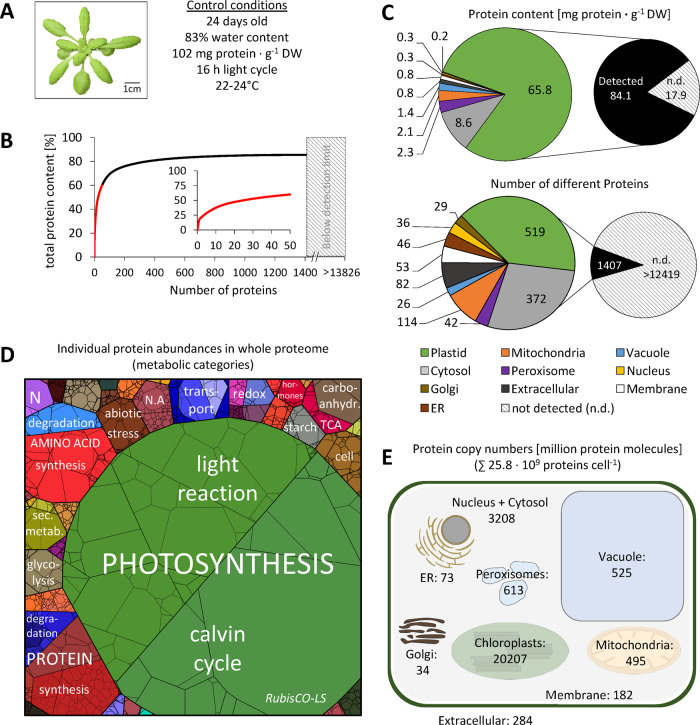
Quantitative composition of the Arabidopsis leaf proteome. (A) Phenotype of a representative control plant used for MS analysis (the rosette was digitally extracted from the soil background). (B) Fraction of total protein content contributed by each of the 1,399 proteins detected by shotgun proteomics. Proteins were sorted according to their absolute content in descending order and added up. The 50 most abundant proteins (red graph) are shown in the inset (the axis label is identical to the main graph). (C) Distribution of the proteins detected in control samples in the different subcellular compartments according to SUBA4 prediction (Hooper et al., 2017). Protein content (sum of all individual protein contents calculated from iBAQs) versus number of different protein species per subcellular compartment. Hatched areas in B and C indicate the protein mass and estimated number of protein groups not detectable by our MS approach. The invisible mass fraction has been calculated on the basis of labeled peptides (Supplemental Figure S2 and Supplemental Dataset S2); the estimated number of leaf protein groups is taken from Mergner et al. (2020). (D) Proteomap illustrating the quantitative composition of the leaf proteome under control conditions. Proteins are shown as polygons whose sizes represent the mass fractions (protein abundances obtained by MS [iBAQ], multiplied with protein molecular weight). Proteins involved in similar cellular functions according to the MapMan annotation file (version Ath_AGI_LOCUS_TAIR10_Aug2012, Thimm et al., 2004) are arranged in adjacent locations and visualized by colors. Mass fractions of the functional categories [%] are provided in Supplemental Dataset S3. (E) Number of protein molecules [million proteins] present in the subcellular compartments of an average Arabidopsis mesophyll cell. Copy numbers represent the sum of protein molecules present in all chloroplasts (ca. 100 per cell; Königer et al., 2008), mitochondria (300–450 per cell; Preuten et al., 2010), or peroxisomes in the cell. Copy numbers for all individual proteins detected in our MS approach are given in Supplemental Dataset S1. Only proteins with unambiguous assignments are shown. N.A., not annotated; N, nitrogen metabolism; LS, large subunit.

