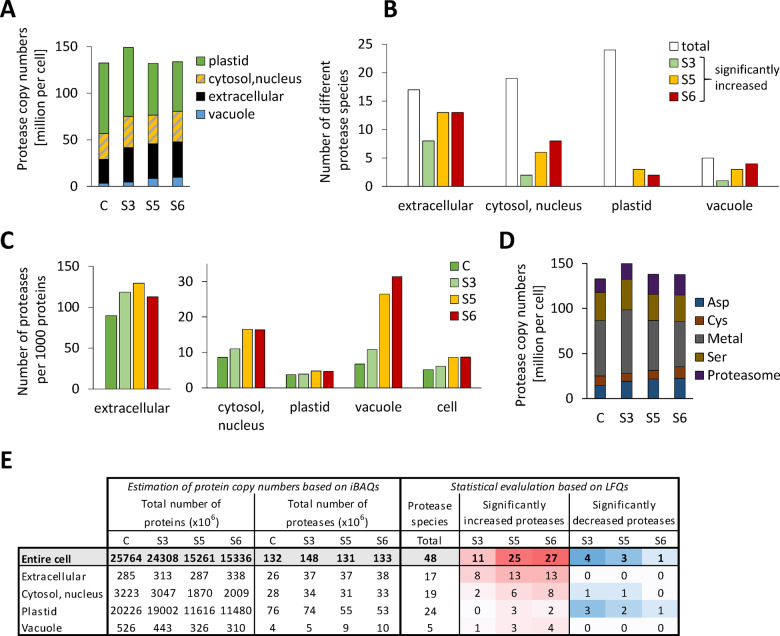
Figure 6.
Adaptation of the proteolytic apparatus during progressive drought stress. (A) Estimated total number and subcellular distribution of protease molecules in an average leaf mesophyll cell under control conditions and during stress. The proteomics dataset (Supplemental Dataset S1) was filtered for the MapMan category “protein.degradation” (Thimm et al., 2004, the filtered list is provided in Supplemental Dataset S5). Protein copy numbers of all enzymes with proteolytic activity (without regulatory proteins and inhibitors) were added up for each subcellular compartment individually (see also E). (B) Significant increase in the abundance of individual protease species during drought stress in the different subcellular compartments. White bars indicate the total number of different proteases detected and colored bars illustrate how many of them were significantly increased based on LFQ values at the respective stress level (Student’s t test, P < 0.05, see also E). (C) Copy numbers of protease molecules per 1,000 proteins in the subcellular compartments of an average mesophyll cell under control conditions and during stress. The protease copy numbers (A) were divided by the total number of protein molecules in the respective subcellular compartment (see E) and multiplied by 1,000. (D) Number of protease molecules sorted by their functional classes. (E) Accumulated copy numbers of all detected proteins and of proteases in the different subcellular compartments. Significant changes in the relative abundance of individual protease species during stress were identified based on LFQ values (Student’s t test, P < 0.05). Color intensities correspond to the number of significant changes (red shading: increase, blue shading: decrease).

