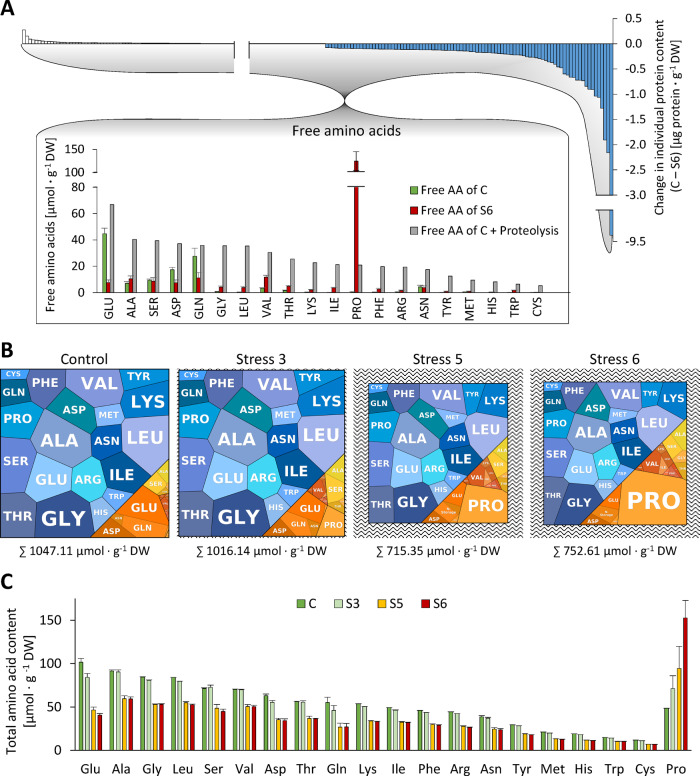
Figure 7.
Interconnection of amino acid pools during progressive drought stress. (A) Effect of proteolysis on free amino acid homeostasis. The quantitative composition of the degraded fraction of the proteome (blue bars) was used to calculate the theoretical composition of the free amino acid pool (gray bars) that would result from massive proteolysis during drought stress (control versus maximum tolerable stress) without any metabolic conversion of the amino acids produced. The actual free amino acid profiles in the leaves of control plants (green bars) and of severely stressed plants (red bars) were analyzed by HPLC. (B) “AMINOmaps” illustrating pool sizes and compositions of the free (orange colors) and protein-bound (blue colors) amino acid pools during progressive drought stress. Amino acids are shown as polygons whose sizes represent the molar fractions. Free amino acid contents were quantified by HPLC, and quantitative amino acid composition of the proteome was calculated on the basis of molar composition of the proteome (see Supplemental Dataset S1) as detailed in the “Materials and methods” section. (C) Total amino acid contents (protein bound plus free) during progressive drought stress. The amino acid contents in proteins were calculated based on iBAQ values. Free amino acid profiles were analyzed by HPLC. Error bars indicate the variability (sd, n = 7) in the free amino acid pool (see Supplemental Datasets S6, S7). AA, amino acid.

