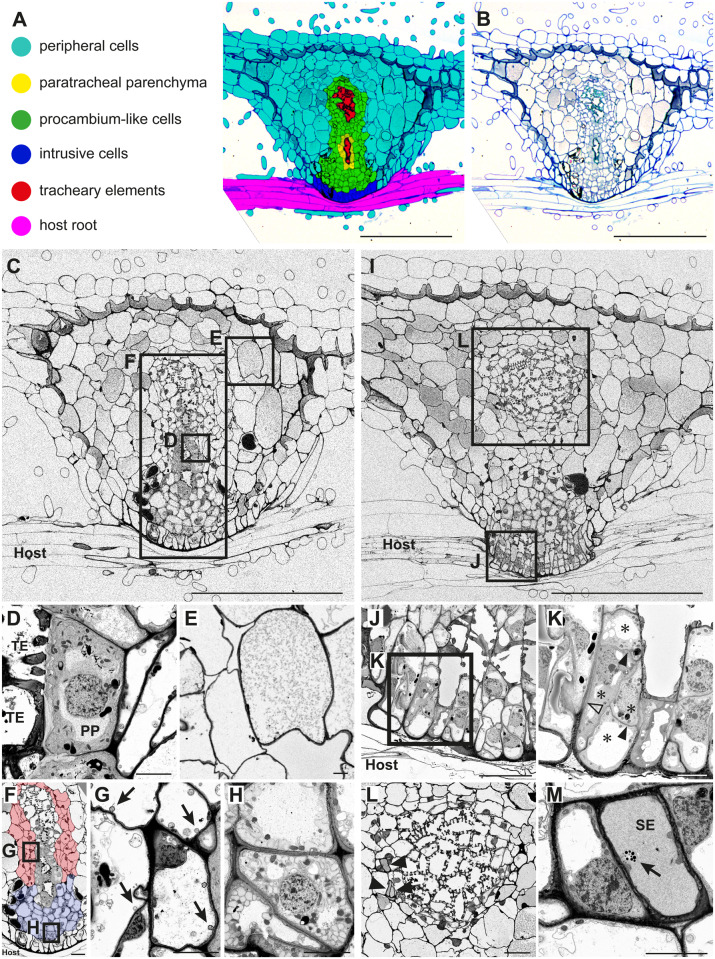
Figure 5.
Tissue distribution and subcellular characteristics of cell types in a P. japonicum haustorium. A, Distribution of each cell type in a haustorium 9 d after infection of an Arabidopsis root. B, Original toluidine blue-stained section image used in A. C, A FE-SEM image at the center of the haustorium with the focus on the xylem bridge. D, A magnified image of PP and TEs from C. E, A magnified image of cortex cells from C. F, A magnified image of the haustorial center from C showing procambium-like cells (marked by blue and red color). Different colors denote different types of procambium-like cells. G, Magnification of the square box in F. Arrows indicate vacuolar membrane invaginations. H, Magnification of the square box in F showing atypical membrane structures in the cytosol of the procambium-like cells. I, A FE-SEM image of a haustorium section with the focus on intrusive cells. J, A magnified image of intrusive cells from I. K, Further magnification of intrusive cells from J. Note that four cells (asterisks) with thin cell wall (closed arrowheads) constitute an elongated cell shape that is enclosed by thicker cell wall (open arrowhead). L, A magnified image showing plate xylem and SEs (arrowheads). L is derived from an independent section, and its corresponding position in the haustorium is indicated in I. M, Magnification of the top most SE in L. A phloem plastid (arrow) was observed. Scale bars, A–C, and I = 200 µm; F, J, and L = 20 µm; D, E, G, H, K, and M = 5 µm.

