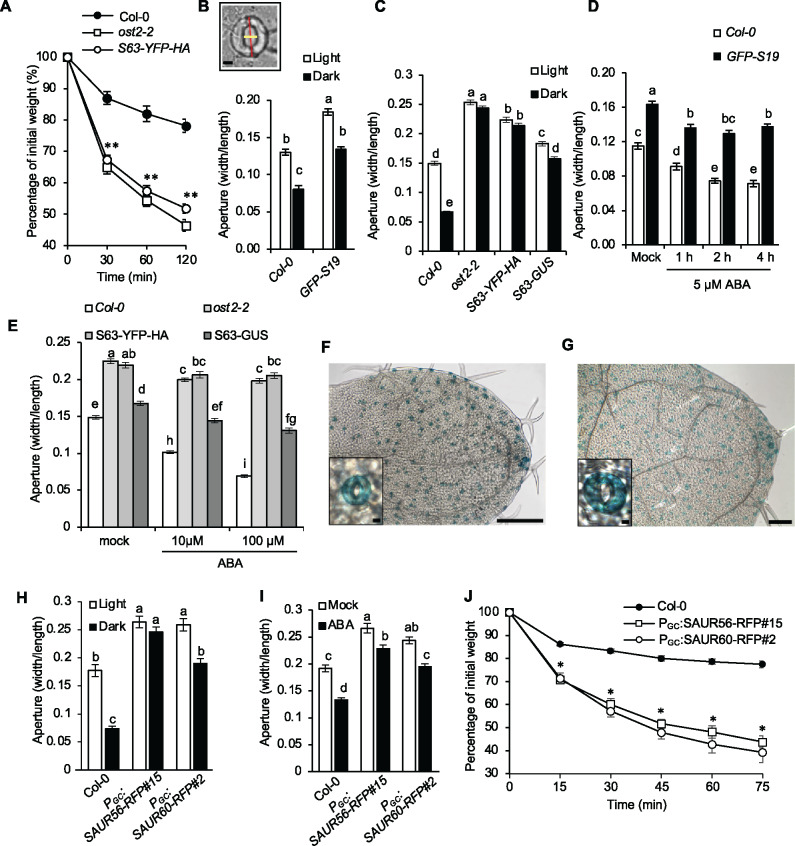
Figure 1.
SAUR overexpression confers larger stomatal aperture. (A) Water loss in leaf detachment assays of wild-type Col-0, ost2-2, and 35S:SAUR63-YFP-HA plants. Data are means ± se (n = 15). (B) Stomatal aperture measurements of wild-type Col-0 and 35S:GFP-SAUR19 plants during light and dark conditions for 2 h. Data are means ± se (n = 60). Inset depicts aperture width/length stomate measurements. Scale bar = 5 µm. (C) Stomatal aperture measurements of wild-type Col-0, ost2-2, 35S:SAUR63-YFP-HA, and 35S:SAUR63-GUS plants during light and dark conditions for 2 h. Data are means ± se (n ≥ 106). (D) Stomatal aperture measurement of wild-type Col-0 and 35S:GFP-SAUR19 plants following treatment with 5 µM ABA. Data are means ± se (n = 60). (E) Stomatal aperture measurements of wild-type, ost2-2, 35S:SAUR63-YFP-HA, and 35S:SAUR63-GUS after 1h treatments with 10 or 100 µM ABA. Data are means ± se (n ≥ 113). X-Gluc staining of young leaves from PSAUR56:SAUR56-GUS (F) and PSAUR60:GUS (G) seedlings. Scale bars = 250 µm (whole leaf), 5 µm (inset). Stomatal aperture measurements of wild-type, PGC:SAUR56-RFP, and PGC:SAUR60-RFP plants during light and dark conditions (n ≥ 48) (H) or following a 1 h treatment with 100 µM ABA (n ≥ 65) (I). (J) Water loss in leaf detachment assays of wild-type, PGC:SAUR56-RFP and PGC:SAUR60-RFP plants. Data are means ± se (n = 6). All experiments were repeated at least twice with similar results. Different letters above error bars indicate significant difference (P < 0.05) by one-way analysis of variance analysis with Tukey’s HSD test. (A and J) Asterisks indicate significant difference from the wild-type (P < 0.05, Student’s t test).

