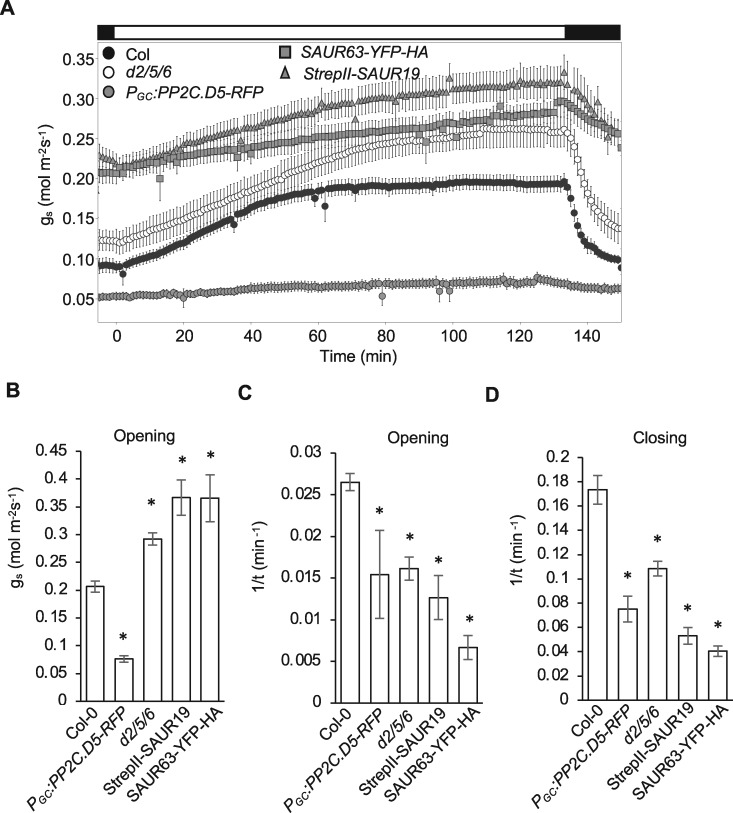
Figure 3.
Gas exchange analyses of pp2c.d2/5/6 mutant and SAUR19/63 overexpression plants. (A) Stomatal conductance (gs) response from dark-adapted leaves exposed to light and subsequent transfer back to darkness. Data are means ± se (n ≥ 5). Bar above figure indicates dark/light/dark transitions. Bar graphs represent (B) maximum stomatal opening, (C) b value of opening, and (D) b value of closing. Data are means ± se (n ≥ 4). Asterisks indicate statistically significant differences relative to wild-type Col-0 determined by one-way analysis of variance Holm test (P < 0.05).

