Figure 4.
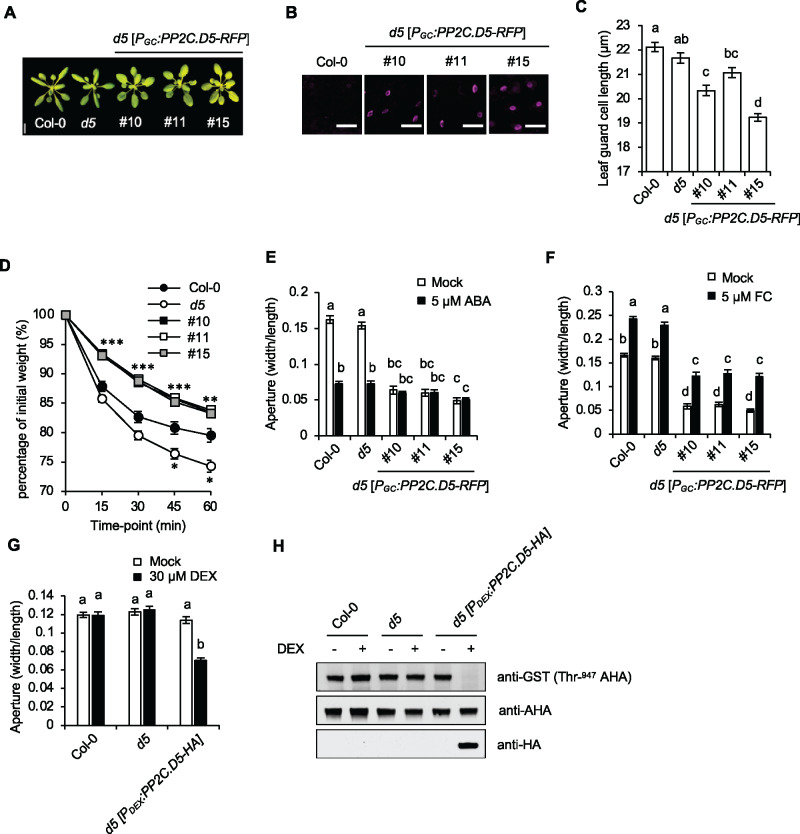
Overexpression of PP2C.D5 in guard cell confers constitutively closed stomata. (A) 24-d-old plants. Three independent PGC:PP2C.D5-RFP lines are shown. Scale bar = 1 cm. (B) Guard cell-specific expression of PGC:PP2C.D5-RFP (magenta) in 14-d-old leaves with wild-type Col-0 as the negative control. Scale bar = 50 µm. (C) Stomatal length of leaf guard cells of wild-type Col-0, pp2c.d5 and pp2c.d5 [PGC:PP2C.D5-RFP] plants. Data are means ± se (n = 120). (D) Water loss in leaf detachment assays of wild-type Col-0, the pp2c.d5 single mutant, and PGC:PP2C.D5-RFP lines. Data are means ± se (n = 11). Asterisks indicate significant difference from the wild-type (P < 0.05, Student’s t test). The number of asterisks indicate the number of PGC:PP2C.D5-RFP lines that differed significantly from wild-type at each time point. (E) Stomatal aperture measurements of wild-type Col-0, the pp2c.d5 single mutant, and PGC:PP2C.D5-RFP lines following 2 h mock or 5 µM ABA treatments. Data are means ± se (n = 60). (F) Stomatal aperture measurements of wild-type Col-0, the pp2c.d5 single mutant, and PGC:PP2C.D5-RFP lines following 2 h mock or 5 µM FC treatments. Data are means ± se (n = 60). (G) Stomatal aperture measurements of wild-type Col-0, the pp2c.d5 single mutant, and PDEX:PP2C.D5-HA lines in the absence or presence of 30 µM DEX treatment for 5 h. Data are means ± se (n = 60). (H) Examination of AHA Thr-947 phosphorylation in 3-week-old rosette leaves by GST-14-3-3 far-western gel assay. PP2C.D5-HA protein expression levels are shown in the bottom panel. For (C, E–G), different letters above error bars indicate significant difference (P < 0.05) by one-way analysis of variance analysis with Tukey’s HSD test.

