Figure 6.
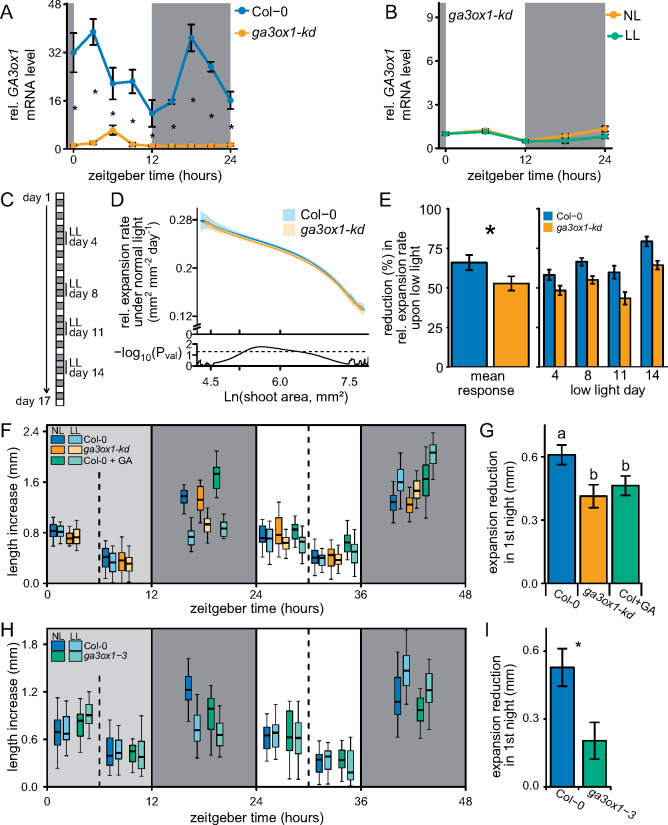
Carbon and GA dependent growth under constant and variable conditions. (A) Transcript levels of GA3ox1 in Col-0 and the ga3ox1-kd line. Data are means ± SE (N = 4). (B) The behavior of GA3ox1 during LL and NL conditions in ga3ox1-kd. Data are as means ± SE (N = 5). (C) A brief schematic of the measuring and treatment regime. (D) Expansion rate during constant high-light conditions for a given projected shoot area. The shaded areas indicate the 95% confidence interval of the mean. The statistical difference between genotypes (Student’s t test) is given below (N = 40). Dashed line indicates P = 0.05. Based on control plants (NL) not confronted by LL days. (E) The reduction in relative expansion rate during a LL day and its subsequent night compared to the expansion rate of the previous days. The reduction for each individual LL day, and the mean LL response over all 4 d are shown. Asterisks indicate the significant difference (ANOVA). Data are means ± SE (N = 40). (F) Lamina length increase (leaf 7) over measured time intervals (6 or 12 h), during and following a LL day. Dark and light gray boxes indicate the night and the LL treatment, respectively. GA4 + 7/mock was applied at ZT12. N = 25, 10-leaf stage plants. (G) Reduction in expansion compared to NL plants specifically at the night following a LL treatment (ZT12–ZT24). Data are means ± SE (N = 25). LL Col+GA growth reduction is compared to Col-0 NL + mock. Letters indicate significant differences (P < 0.05, Tukey HSD). (H, I) Experiment identical to F and G, but with Col-0 and the full knock out ga3ox1-3. Means ± SE (N = 25) are shown, asterisk indicates statistical significance (P < 0.05, Tukey HSD). NL: control normal-light conditions, LL: low-light conditions.

