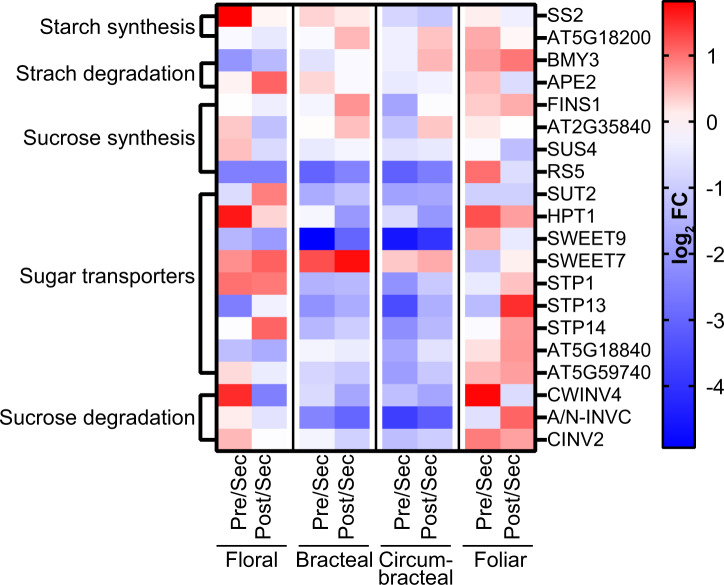
Figure 10.
Expression analysis of genes involved in starch and sucrose metabolism. Normalized RNA-seq data were used to generate heat maps of changes in gene expression as each nectary-type transition from pre-secretory to secretory and from secretory to post-secretory stages of development. The blue–red color scale indicates the relative fold-change (FC) between these developmental transitions. Blue indicates increased expression at the secretary stage of nectary development and red indicates decreased expression at the secretary stage of nectary development. Full names for the abbreviations of individual genes are provided in Supplemental Dataset S9. Abbreviations: Pre = pre-secretory; Sec = secretory; and Post = post-secretory.

