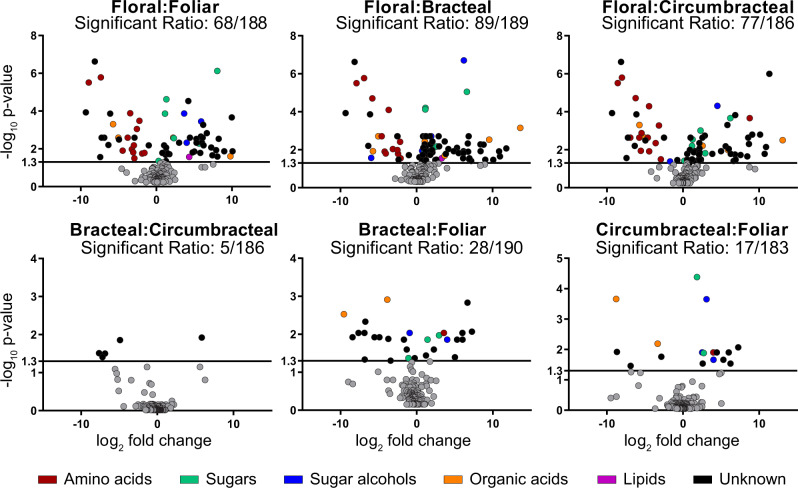
Figure 3.
Volcano plot analyses of all possible pairwise comparisons of G. hirsutum nectar metabolomes. In each comparison, “Significant Ratio” identifies the proportion of the detected analytes whose abundance difference is statistically significant, as determined by an F-test; these data points are non-gray colored and are above the y-axis value of 1.3 (q-value < 0.05; n = 6). The chemical class identity of the metabolites is color-coded for those metabolites that show statistically significant abundance difference. Gray data points represent metabolites whose abundance is not statistically significant in the pairwise comparison.

