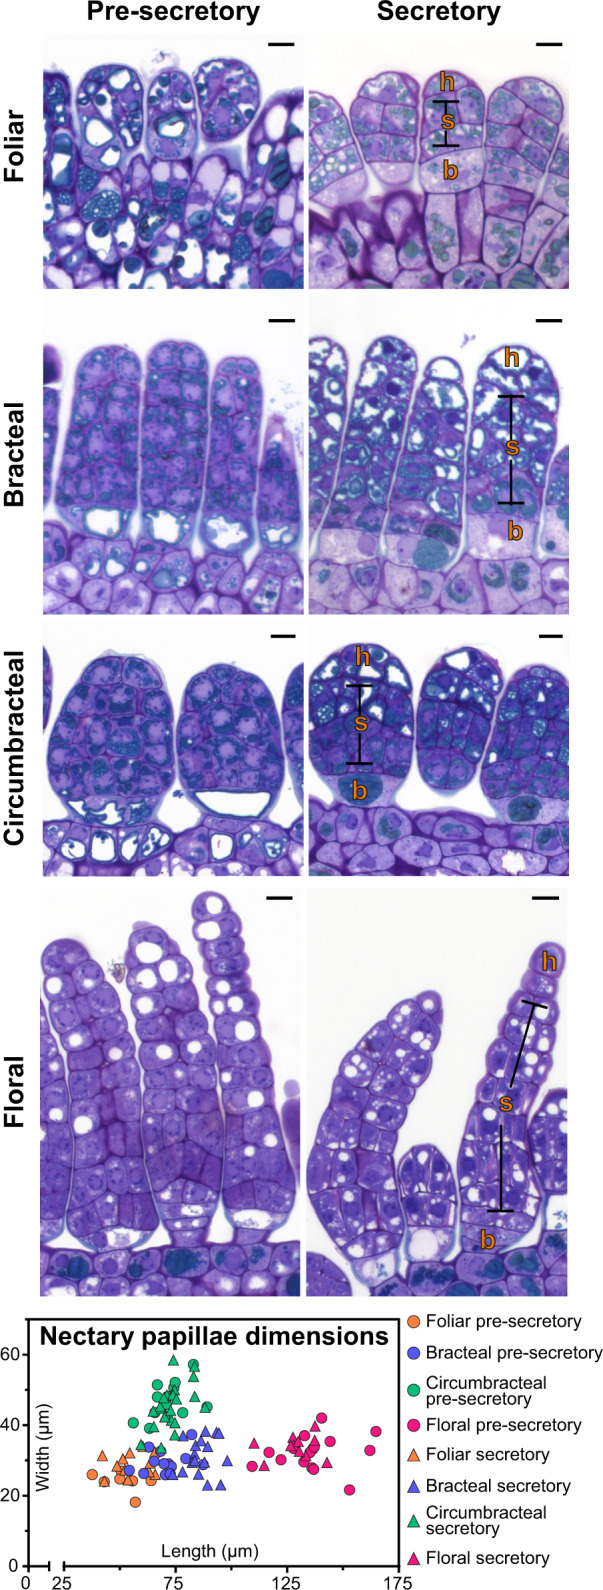
Figure 4.

Light micrographs of longitudinal sections of papillae from the four different G. hirsutum nectary types, stained with toluidine blue O. The nectary papillae dimensions graph plots the length and width distribution of nectary papillae at different stages of development (n = 7–22 papillae for each nectary type). Abbreviations: h = head cells; s = stalk cells; b = basal cells. All scale bars = 10 µm.
