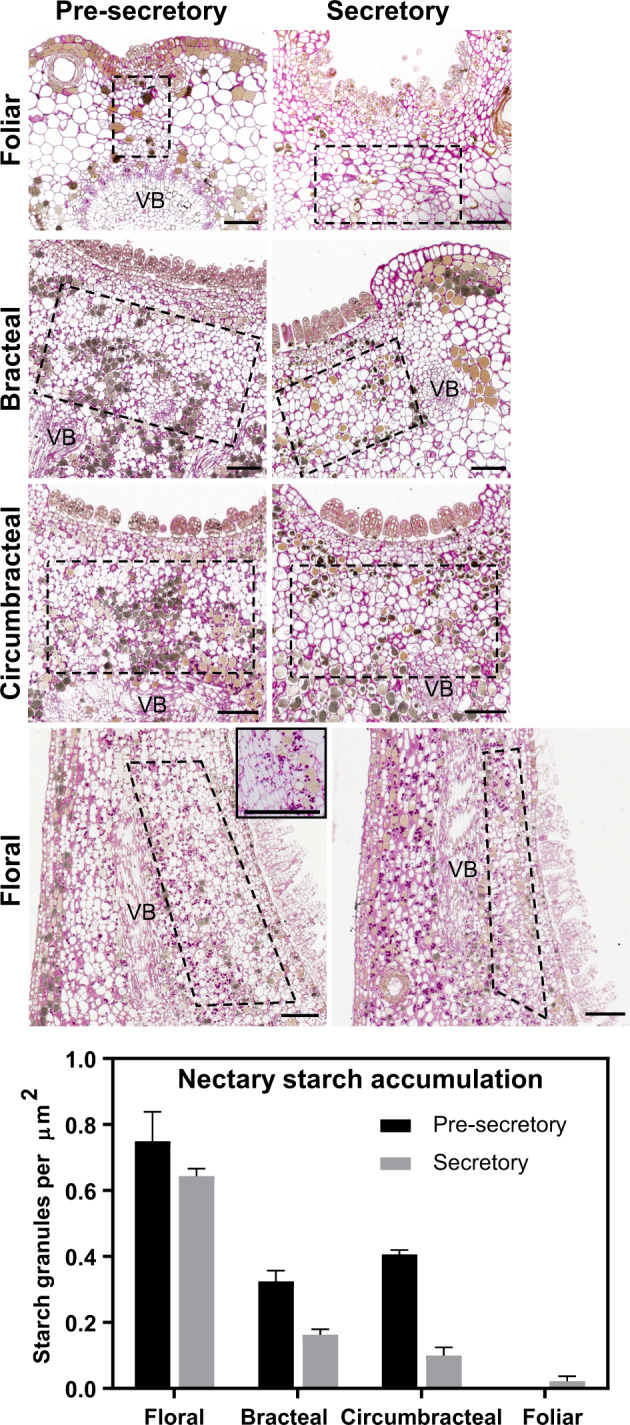
Figure 6.

Light micrographs of longitudinal sections of different G. hirsutum nectaries stained with PAS stain to visualize distribution of starch granules within subnectariferous parenchyma (regions within dashed boxes) during nectary development. The nectary starch accumulation graph plots the density of starch granules within the subnectariferous parenchyma of nectaries during nectary development. For each nectary type and developmental stage, starch granules were counted from a minimum of six sections imaged from two separate nectaries. Error bars represent se. Abbreviations: VB = vascular bundle. All scale bars = 100 µm.
