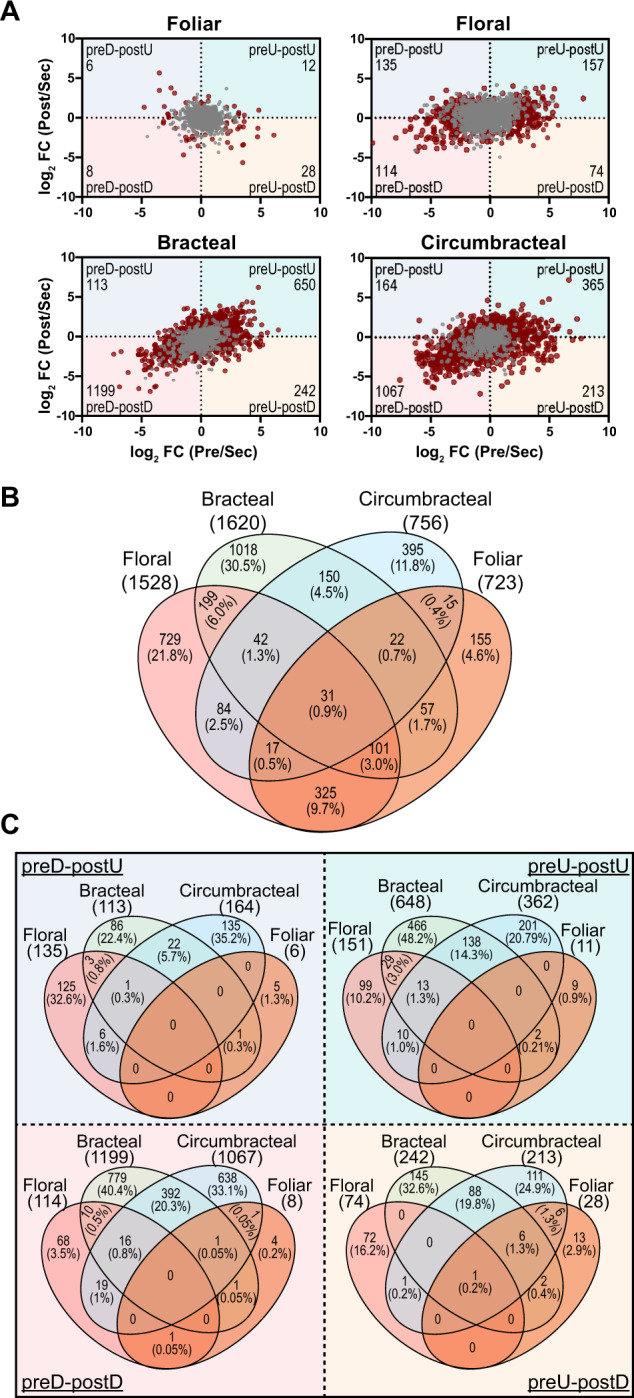
Figure 8.

Differentially expressed genes in four nectary types. A, Scatter plots displaying differentially expressed genes in response to nectary development from presecretory (Pre) to secretory (Sec) to post-secretory (Post) stages, normalized relative to the expression level at the secretory stage. Gray colored data points represent genes that are preferentially expressed in each nectary type with respect to the adjacent non-nectary tissue, but expression is minimally affected by nectary development. Red colored data points represent genes that are differentially expressed in each nectary type, and expression is also modulated by the development of each nectary type. These red data points are divided into four quadrants, which detail changes in gene expression patterns normalized to the secretory developmental stage: (1) down-regulated at the pre-secretory stage and up-regulated at the post-secretory stage (preD–postU); (2) up-regulated at the pre-secretory stage and up-regulated at the post-secretory stage (preU–postU); (3) up-regulated at the pre-secretory stage and down-regulated at the post-secretory stage (preU–postD); and (4) down-regulated at the pre-secretory stage and down-regulated at the post-secretory stage (preD–postD). The number of differentially expressed genes in each sector is identified in the outer corner of each sector. B, Venn diagram representation of the distribution of genes that are preferentially expressed in each nectary type, but expression is not modulated by nectary development (i.e. the genes identified by gray data-points in panel A). The digits identify the absolute number and percentage of genes falling into each subset category. C, Venn diagram representation of the distribution of genes that show nectary-specific expression that also demonstrate temporal patterns of gene expression as the nectaries transition from presecretory, to secretory and to post-secretory stages of development (i.e. overlap among the genes represented by red-colored data-points in panel A.) The digits identify the absolute number and percentage of genes falling into each subset category.
