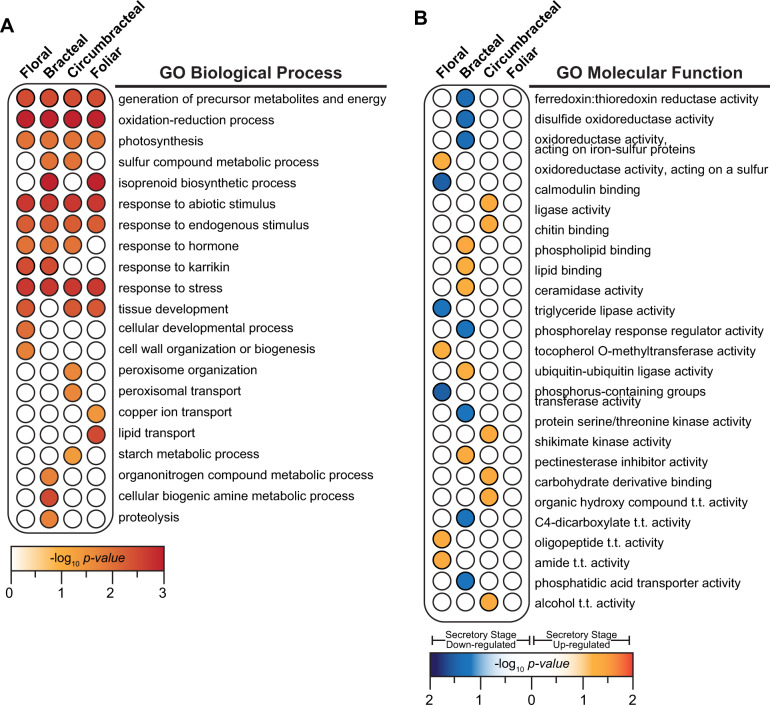
Figure 9.
GO enrichment analysis. A, Genes identified in Figure 7, B that are preferentially expressed in each nectary type, but expression is not modulated by nectary development. B, Genes identified in Figure 7, C, as uniquely up- or down-regulated during the secretory stage of development in each nectary type. Redundancy in the lists of enriched GO terms was removed using REVIGO (Supek et al., 2011). Details of the results are provided in Supplemental Datasets S5, S8. Abbreviations: t.t. = transmembrane transporter.

