
Fig. 1. Schematic summary of the experimental conditions we investigated using diamond magnetometry (and compared to a conventional dye).
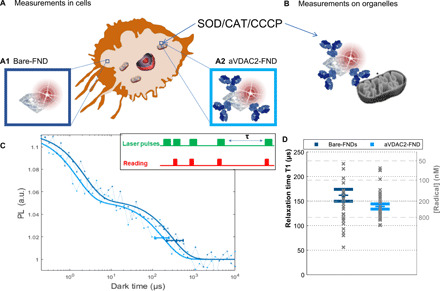
(A) First, we investigated free radical formation in single cells. Here, we differentiated between two subcellular locations: the cytosol reached by uncoated FNDs (A1) and the mitochondria reached by aVDAC2 antibody–coated FNDs (A2). (B) Measurements on single isolated mitochondria. In all conditions, we compared measurements before and after stimulation with CCCP in different concentrations: CAT (final concentration of 1000 U/ml) and SOD (final concentration of 600 U/ml). (C) The T1 relaxation curve is generated from different dark times plotted against the fluorescence intensity. The inset shows the pulsing sequence used in relaxometry experiments. The green blocks indicate when the laser was on, while the red blocks indicate when we read out the photoluminescence (PL) from the FND. The horizontal error bar indicates the position of the T1 time and the 95% confidence interval obtained with the fitting procedure. This T1 time gives a measure of radical concentration in the surroundings. The representative curves shown are from bare FNDs, or aVDAC2-coated FNDs, before applying any treatment. a.u., arbitrary unit. (D) Statistical distribution (mean and SE) of T1 from 26 and 36 FNDs (all the “initial conditions” are represented hereafter).