
Fig. 2. Free radical detection.
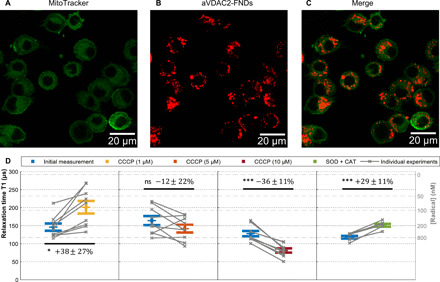
(A to C) Confocal images of FNDs (1 μg/ml) with adsorbed aVDAC2 antibodies incubated with cells (104 cells/ml) for 14 hours. Green, MitoTracker Green–stained mitochondria; red, aVDAC2-FND. (D) Single-cell free radical measurement by T1. After recording the initial T1 (blue), 1, 5, and 10 μM CCCP as well as SOD (1000 U/ml) and CAT (600 U/ml) were tested on the same samples. The error bars represent SEs. Gray lines show individual experiments on single cells. The left gray axis represents the approximated concentration determined from a calibration with *OH radicals in solution from the previous work (45). The experiments were repeated nine times. Data were analyzed using a paired t test to compare between groups with a *P ≤ 0.05 and ***P ≤ 0.001 significance.