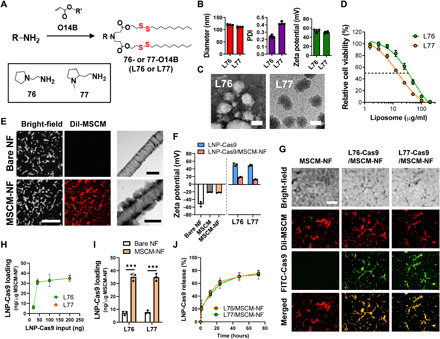
Fig. 2. Synthesis and characterization of Cas9-loaded lipidoid nanoparticles (LNP-Cas9) and MSCM-NF.

(A) Synthesis of bioreducible lipids 76-O14B and 77-O14B. (B) Size, PDI, and zeta potential of blank LNPs, measured by dynamic light scattering. (C) TEM images of LNP-Cas9 nanoparticles L76-Cas9 and L77-Cas9. Scale bars, 100 nm. (D) Cytotoxicity of blank LNPs L76 and L77. Cell viability was measured using CellTiter-Glo after 24 hours of treatment. (E) (Left) CLSM images of bare NF and MSCM-NF. MSCM was stained with DiI dye (red) to show colocalization of NF and MSCM. Scale bar, 50 μm. (Right) TEM images of bare NF and MSCM-NF. Scale bars, 500 nm. (F) Zeta potential of free LNP-Cas9 or LNP-Cas9 on MSCM-NF. (G) CLSM images showing colocalization of FITC-LNP-Cas9 and DiI-MSCM-NF. Scale bar, 50 μm. (H) Loading efficiency profile of LNP-Cas9 on MSCM-NF as a function of the amount of LNP-Cas9 added. (I) LNP-Cas9 loading of bare NF or MSCM-NF as 200 ng of LNP-Cas9 was added. (J) Release profile and efficiency of LNP-Cas9 on MSCM-NF. Data are means ± SD. ***P < 0.0001; Student’s t test.
