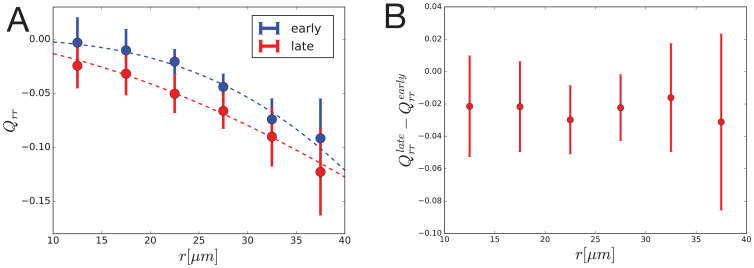
Appendix 1—figure 1. Dynamics of radial cell elongation profile.
Left: Radial cell elongation in the first half of the movies (’early’) are shown in blue and in the second half of the movies (’late’) are shown in red. Fits of power law are shown with dashed lines in corresponding colors, with fit parameters , and , for "early" and "late" profiles, respectively. Right: Radial cell elongation change suggests that there is no significant gradient of radial shear due to cell rearrangements during the experiment.

