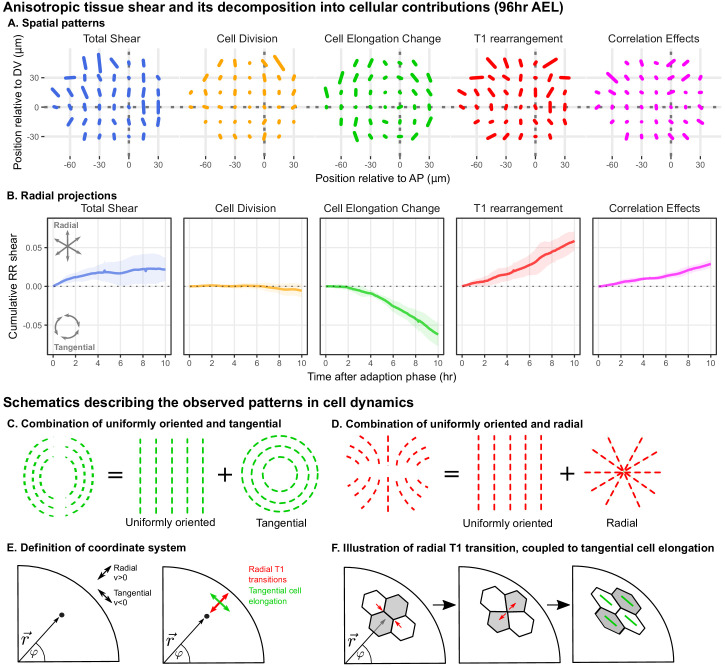
Figure 2. Radially oriented cell rearrangements balance tangential cell elongation.
(A) Cumulative tissue deformation and its cellular contributions, measured in a grid centered on the compartment boundaries (dotted gray lines) and averaged over all five movies. Bars represent nematic tensors, where the length is proportional to the magnitude of deformation and the angle indicates its orientation. The contribution from cell extrusion is small and thus not shown. Data used to present these plots are included in Figure 2—source data 1. (B) The radial projection of cumulative tissue deformation and its cellular contributions are plotted as a function of time after the first of adaption to culture (Dye et al., 2017). Solid lines indicate the average over all five movies; shading indicates the standard deviation. Data used to present these plots are included in Figure 2—source data 2. (C) Schematics indicating how a uniformly oriented pattern would combine with a tangential pattern to produce a pattern resembling that of the cell elongation change (left) or with a radial pattern to produce a pattern resembling that of the T1 transitions (right). (E–F) Illustrations demonstrating radially-oriented T1 transitions coupled to tangential cell elongation. For simplicity, we diagram only the posterior-dorsal quadrant, but the pattern is radially symmetric. In (E), we define the radial coordinate system, where velocity in the radial direction is positive and that in the tangential direction is negative. Patterns in A indicate that T1 transitions are biased to grow new bonds in the radial direction, and cell elongation is biased to increase tangentially. (F) In a radially oriented T1 transition, cells preferentially shrink tangentially oriented bonds and grow new bonds in the radial direction. When oriented in this direction, T1 transitions do not dissipate tangential elongation but increase it (green bars in each cell represent cell elongation).

