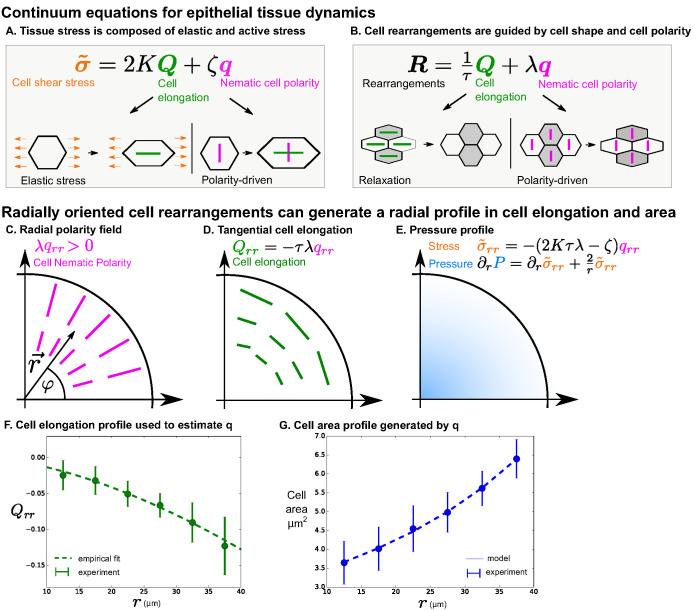
Figure 3. Polarity-driven cell rearrangements can create the observed cell morphology patterns.
(A) Stress is a combination of elastic and polarity-driven stresses. Similarly, in (B), cell rearrangements occur to relax a stretched cell shape or to respond to an internal nematic cell polarity cue. In the cartoons in (A)-(B), we chose to depict scenarios where and are . (C–G) We apply this model to a radially symmetric tissue at steady state to approximate the wing disc. If we impose a radial polarity field (C), cell elongation is oriented in the opposite direction, according to the equation in (D) when (steady state). (E) Considering force balance in the tissue, our model also predicts a pressure profile with higher pressure in the center. (F) To fit experimental data in the wing disc, we estimate the radial profile of from Equation 4 by measuring cell elongation as a function of in the last () of the timelapse. We solve for by making an empirical fit to this cell elongation data (see Appendix 1 part 2). (G) The cell area distribution we observe in the wing disc is consistent with the pressure profile predicted by our model (E and Appendix 1 part 2).

