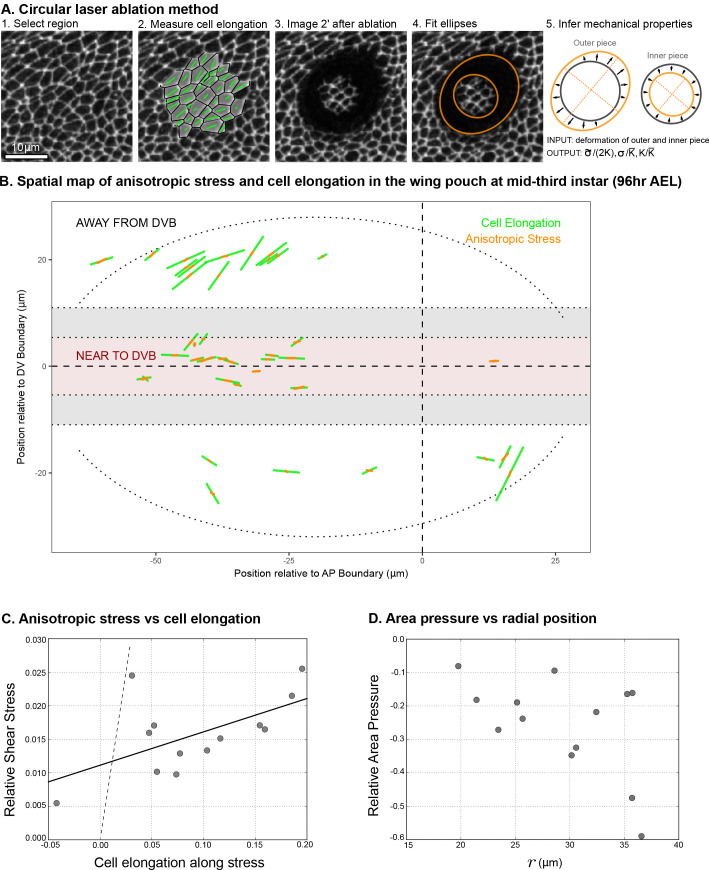
Figure 4. Circular laser ablation reveals patterns of tissue stress.
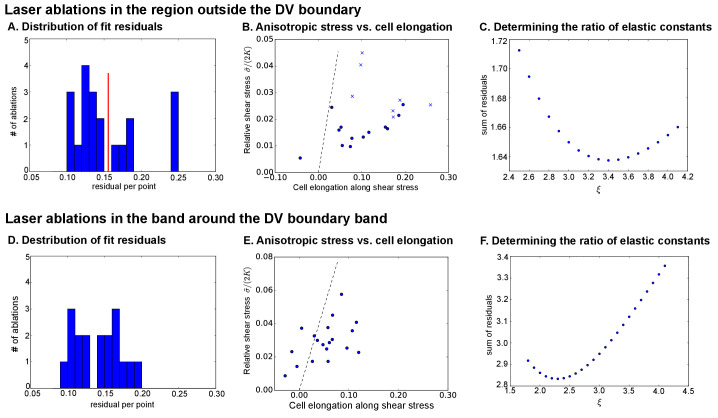
(A) Description of the circular laser ablation method ESCA. The tissue is cut in a circle (radius ), and cell elongation is averaged in this region before the cut. After the tissue relaxes (), we fit ellipses to the cut region. We then infer mechanical properties using our model, which inputs deformation and outputs stress as a function of elastic constant and the ratio of the isotropic and anisotropic elastic constants (see also Figure 4—figure supplement 1). (B) Map of stress and cell elongation in the wing disc ( AEL). Each line represents a nematic, where length indicates the magnitude, and angle indicates its orientation. Each data point comes from a different wing disc. The gray region indicates a border region, in which a cut would straddle the two regions. Cuts centered in this region were not included in the analysis. The dotted lines on either side of the DV boundary indicate our cut-offs for delineating the border and DV boundary regions (see Materials and methods). (C) Magnitude of anisotropic stress () is plotted against cell elongation (projected onto the stress axis) for all ablations outside the DV boundary. Dotted line indicates a line with slope , corresponding to a tissue lacking a nematic cell polarity cue. Fit line is solid black (See Appendix 2). Data for the DV boundary region is presented in Figure 4—figure supplement 1D-F. (D) Relative area pressure is plotted against for all ablations outside the DV boundary. The correlation coefficient . Data used in this figure are included in Figure 4—source data 1.


