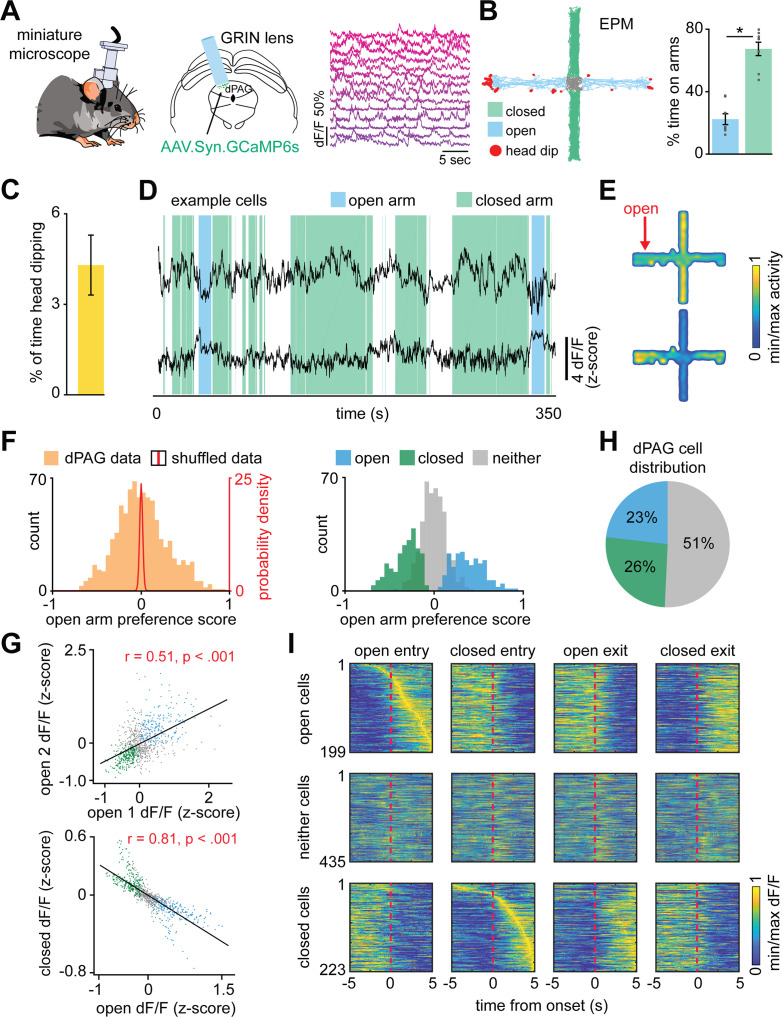
Figure 1. Dorsal periaqueductal gray (dPAG) neuronal ensembles encode arm type in the elevated plus maze (EPM).
(A) Gradient refractive index (GRIN) lens implantation, virus expression strategy, and example Ca2+ signals of neurons in the dorsal periaqueductal gray (dPAG). (B) Example mouse exploration path recorded in the EPM. Mice spent significantly more time in the closed arms compared to the open arms (data are represented as mean ± SEM; W = 0, p=0.012, Wilcoxon signed rank test, n = 8 mice). (C) Mean percentage of time in which mice engaged in head dips during the whole EPM session (n = 8 mice). (D) dPAG dF/F traces from the same mouse that display preferential activity in the closed (upper trace) and open (lower trace) arms of the EPM (open and closed arm-preferring cells). Epochs corresponding to exploration of the closed and open arms are shown respectively as green and blue shaded areas. (E) Activity heatmaps for corresponding example neurons shown in (D). (F) The open arm preference score was calculated for each neuron (orange bars; see Materials and methods), as was the distribution of open arm preference score for shuffled data (red line). Bars show the distribution of open arm preference score for open, closed, and neither cells (n = 857 cells). (G) Scatterplots showing correlations between neural activity across the two open arms (top) and between open and closed arms of the EPM (bottom). Each point represents one cell (n = 857 cells, r = Pearson’s correlation coefficient). (H) Pie chart shows the percent of all recorded neurons that were classified as open, closed, or neither cells (n = 857 cells). (I) For each subplot, each row depicts the mean normalized activity of an open, closed, or neither arm-preferring cell during behavior-aligned arm transitions (n = 857 cells).


