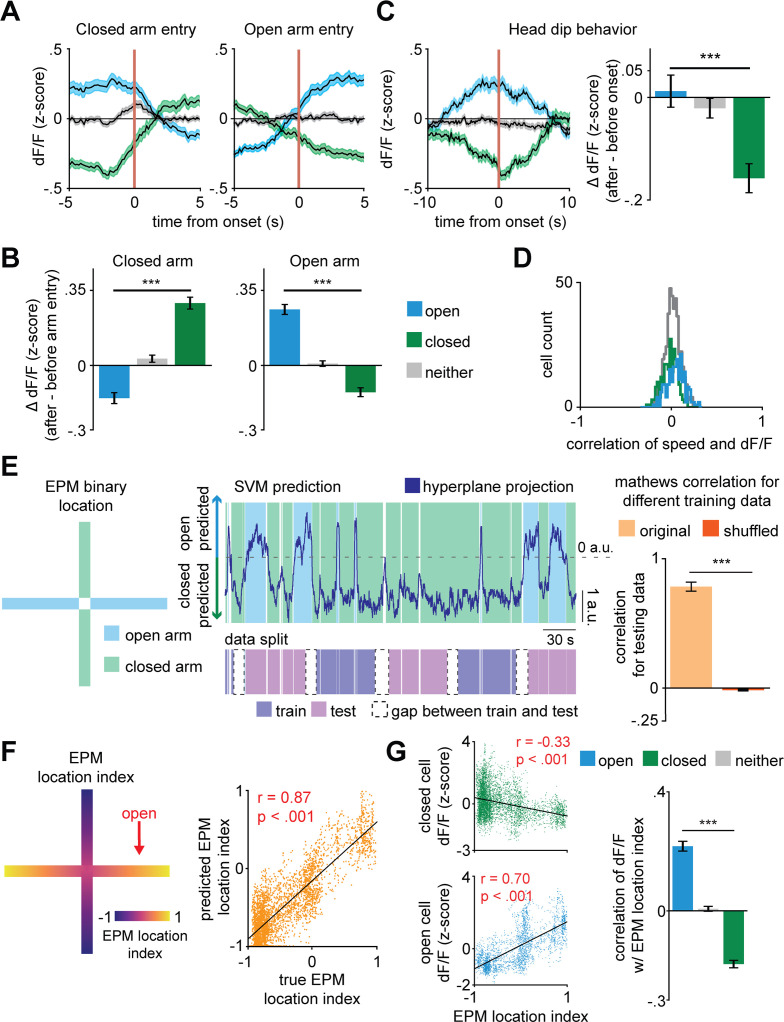
Figure 2. Dorsal periaqueductal gray (dPAG) population activity predicts elevated plus maze (EPM) exploration.
(A) Traces show the mean z-scored activity (±1 SEM) of all open, closed, and neither cells, behavior-aligned to arm transitions (respectively the blue, green, and gray traces). Cell categorization and calculated results were performed on non-overlapping training and testing data (n = 180 open cells, n = 513 neither cells, n = 164 closed cells). (B) Bars depict the change in z-scored dF/F for entries to closed left) and open (right) arms, separately for open, closed, and neither cells (data are represented as mean ± SEM; both closed and open arms; n of cells same as (A); closed arm U = 10.6, ***p<0.001, open arm U = 10.8, p<0.001, Wilcoxon rank sum test, n = 8 mice). (C) Average activity traces for open, closed, and neither cells relative to onset of head dips in the EPM and quantification of changes in activity for all cell types (0–2.5 s after minus 2.5–5.0 s before head dip onset) (data are represented as mean ± SEM; n of cells same as (A); U = 3.9, ***p<0.001, Wilcoxon rank sum test). (D) Histograms depict the distribution of the Pearson’s correlation of dF/F with speed for each cell type in the EPM (n of cells same as Figure 1I. (E) Prediction of arm-type mouse position in the EPM from neural data using a linear support vector machine (SVM). The blue and green areas represent the actual arm-type occupancy label (open and closed arm, respectively), and the black trace represents the prediction of arm location by the SVM hyperplane projection. If the trace was above 0 a.u., then that period was classified as open arm exploration, otherwise, it was classified as closed arm occupancy. The pink and purple represent the data split (training and testing data, respectively). The Matthews correlation coefficient for real and permuted shuffled training data are shown to the right (mean ±1 SEM; n = 8 mice, U = 4.9, p<0.001, Wilcoxon rank sum test). (F) (Left) Example of EPM location index where 1 and −1 correspond, respectively, to the extreme end of the open and closed arms and (right) prediction of labeled EPM location index from dPAG neural data for an example mouse (scatterplot displays testing data that was not used for training, r = Pearson’s correlation coefficient). (G) (Left) Correlation of example closed and open cell activity and (right) mean correlation of dF/F with EPM location index (data are represented as mean ± SEM; n of cells same as (A); U = 13.7, ***p<0.001, Wilcoxon rank sum test, r = Pearson’s correlation coefficient).


