. 2021 May 6;10:e64934. doi: 10.7554/eLife.64934

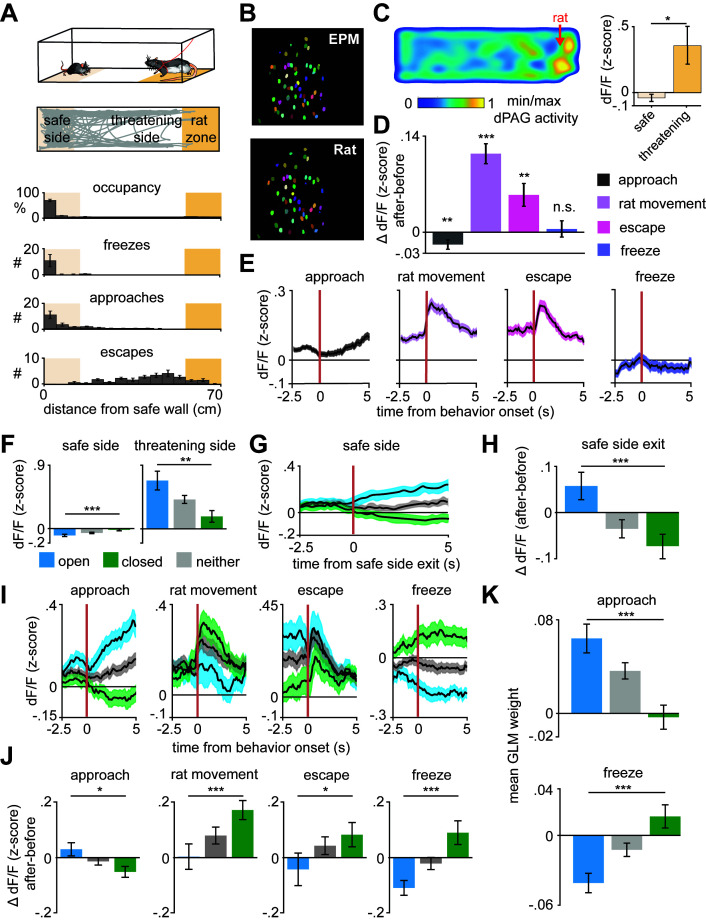
Figure 3. Arm-specific ensembles maintain functions across threatening situations.

(A) Illustration of the rat exposure assay (top) and example track (bottom), with labels depicting the area to which the rat is confined (rat zone) as well as areas near to and far from the rat (safe side). In all figures depicting this assay the rat area will be shown to the right. (B) Example imaging field of view with dorsal periaqueductal gray (dPAG) cells co-registered between elevated plus maze (EPM) and rat exposure sessions. (C) Heatmap depicts the mean z-scored dF/F at each position of the rat exposure assay (left, n = 713 cells). Mean dF/F is significantly greater in the threatening zone than in the safe zone (n = 713 cells, n = 7 mice, U = 2.24, p=0.03, Wilcoxon rank sum test). (D) Change in dF/F (0–2.5 s after minus 0–2.5 s before) activity for all dPAG cells for behaviors in the rat exposure assay (data are represented as mean ± SEM; n of cells for approach, rat movement, escape = 714, n of cells for freeze = 640; approach t = −2.65, **p=0.008, rat movement t = 7.87, ***p<0.001, escape t = 3.28, **p=0.001, freeze t = 0.39, p=0.69, one-sample t-test). (E) Traces show the mean z-scored activity of all cells (±1 SEM), aligned to onset of various behaviors (onset is indicated by the red vertical line) in the rat exposure assay (n of cells same as D). (F) Bars depict the mean z-scored dF/F of cells on the safe side and threatening side of the enclosure (data are represented as mean ± SEM; n = 64 open cells, n = 166 neither cells, n = 87 closed cells; n = 7 mice, safe U = −3.82, ***p=0.0001, threatening U = 3.05, **p=0.002, Wilcoxon rank sum test). (G) Traces show the mean z-scored activity of open, closed, and neither cells (±1 SEM), aligned to exit of the safe side of the enclosure (far from the rat). (H) Bars show the mean change in z-scored dF/F (0–2.5 s after minus 0–2.5 s before) aligned to safe side exit for open, closed, and neither cells (data are represented as mean ± SEM; n = 64 open cells, n = 166 neither cells, n = 87 closed cells; U = 3.29, ***p=0.001, Wilcoxon rank sum test). (I) Traces show the mean z-scored activity of open, closed, and neither cells (±1 SEM), aligned to behaviors in the rat exposure assay (approach, rat movement, escape: n = 64 open cells, n = 87 closed cells, n = 166 neither cells; freeze: n = 50 open cells, n = 67 closed cells, n = 132 neither cells). Onset of behaviors is indicated by a red vertical line. (J) Bars depict the change in z-scored dF/F (0–2.5 s after minus 0–2.5 s before) for behaviors in the rat exposure assay, separately for open, closed, and neither cells (data are represented as mean ± SEM; n of cells same as (I); approach U = 2.45, *p=0.014, rat movement U = −3.70, ***p=0.0002, escape U = −2.12, *p=0.034, freeze U = −3.62, ***p=0.0003, Wilcoxon rank sum test). (K) A generalized linear model (GLM) to predict single-cell activity was constructed using approach, escape, and freeze behaviors as variables. Bar plots show average GLM weights for approach and freeze for open, closed, and neither cells (data are represented as mean ± SEM; n = 62 open cells, n = 155 neither cells, n = 83 closed cells; approach U = 4.17, ***p<0.001, p=0.11, freeze U = 3.02, ***p<0.0002, Wilcoxon rank sum test).

Figure 3.

Figure 3—figure supplement 1. Validation of co-registration procedure.
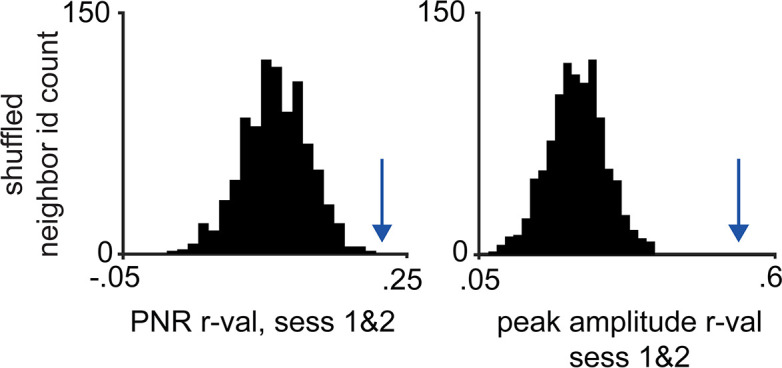
Figure 3—figure supplement 1.

The peak-to-noise ratio (PNR) and mean peak amplitude correlation values were calculated for co-registered cells between rat and elevated plus maze (EPM) assays. Cell identities were then shuffled within the 10 nearest neighbors 1000 times, and the same correlation measures were calculated for each iteration. The resulting distribution was compared to the actual PNR and mean peak amplitude values, indicated with arrow (for both left and right, n = 462; p<0.001, n = 7 mice).

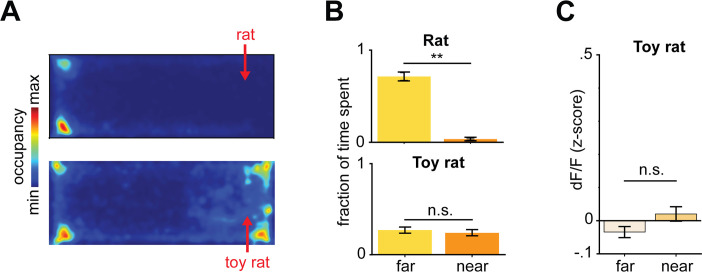
Figure 3—figure supplement 2. Behavioral and dorsal periaqueductal gray (dPAG) activity differences between rat and toy rat exposure.

Figure 3—figure supplement 2.

(A) Heatmaps depicts the maximum and minimum spatial occupancy of mice during rat (top) and toy rat exposure (bottom). (B) Fraction of time spent near and far from rat (top, U = 3.13, p=0.0017, Wilcoxon rank sum test, n = 7 mice) and toy rat (bottom, U = 0.70, p>0.05, Wilcoxon rank sum test, n = 7 mice). (C) Average z-scored dPAG activity far and near to a toy rat (U = 1.85, p>0.05, Wilcoxon rank sum test, n = 7 mice).

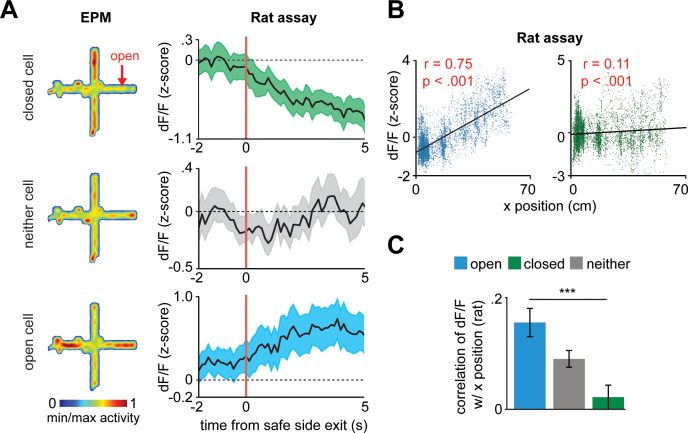
Figure 3—figure supplement 3. Correlation of dorsal periaqueductal gray cell ensembles with distance to a rat.

Figure 3—figure supplement 3.

(A) Heatmaps show the normalized activity of example open, closed, and neither cells during the elevated plus maze (EPM) session (left). Traces show the normalized activity of the same cells when exiting the safe side of the rat assay and moving toward the rat (right). (B) Correlation of example open and closed cell activity with distance from the safe wall (rat exposure). Higher x position corresponds to locations more near the rat. (C) Mean correlation of dF/F with x position in the rat assay (data are represented as mean ± SEM; n = 64 open cells, n = 166 neither cells, n = 87 closed cells; U = 3.89, ***p<0.001, Wilcoxon rank sum test, n = 7 mice, r = Pearson’s correlation coefficient).

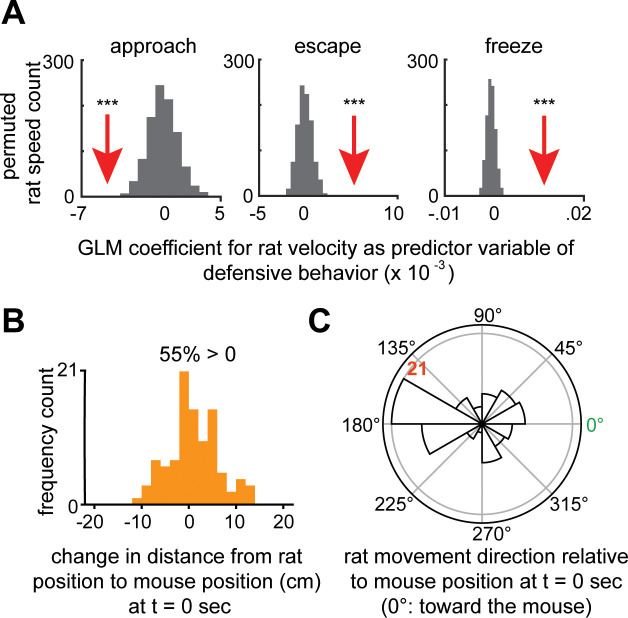
Figure 3—figure supplement 4. Increased rat velocity predicts lower approach to rat and higher threat avoidance-related behaviors such as escape and freeze.

Figure 3—figure supplement 4.

(A) Separate generalized linear models (GLMs) were fit with rat velocity as the predictor variable and one of the binarized mouse behaviors: either approach (left), escape (middle), or freeze (right), as the response variable. The red arrow depicts the actual GLM coefficient for rat velocity, given each mouse behavior, while the histogram depicts the permuted distribution of rat velocity coefficient values for shuffled timepoints. Compared to this distribution, rat velocity shows a significantly negative coefficient for approach and significantly positive coefficients for escape and freeze. These data show that higher rat velocity predicts decreased occurrence of approach and increased frequency of escape and freezing (***p<0.001, n = 7 mice). (B) On average, rat movements do not decrease distance to the mouse’s position at the start of rat movement (measured 2 s after movement start). Negative values indicate movement toward the mouse (n = 100 occurrences). Fifty-five percent of rat movements increase distance from the mouse, indicating that rat movements are not consistently directed at the mouse which would be expected to decrease rat-mouse distance. (C) Rat movements are not consistently directed toward mice. Polar plot showing the distribution rat movement direction relative to mouse position at the start of rat movement initiation. Zero degrees represents movement toward the mouse, while 180 degrees corresponds to movements away from the mouse. Radius values = number of events.

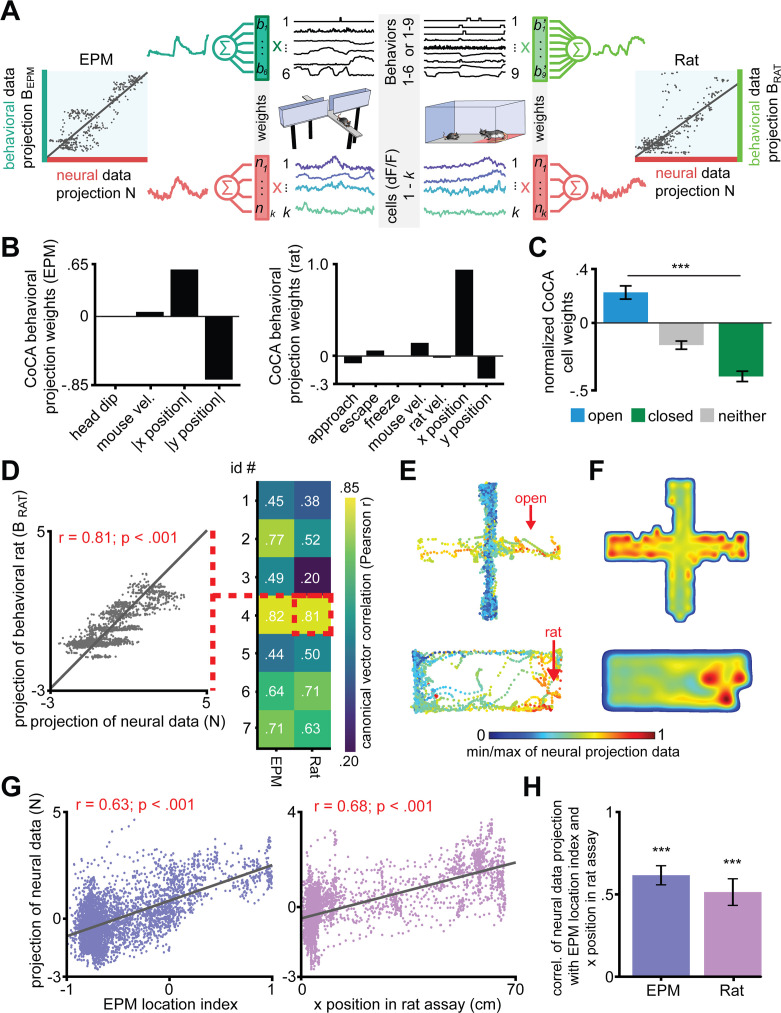
Figure 3—figure supplement 5. Dorsal periaqueductal gray (dPAG) displays a shared neural representation of risk imminence across the elevated plus maze (EPM) and rat exposure assays.

Figure 3—figure supplement 5.

(A) Constrained correlation analysis (CoCA) reveals correlated encoding of behaviors and neural activity consistent across EPM and rat exposure assays. Linear projections of behaviors (top) correlate with projections of neural activity (bottom). Weights were optimized to maximize the correlation between neural and behavioral projections. Weight selection was constrained in the following way: weights for behavioral variable weights for each assay had to be conserved across mice, whereas neural projector weights had to be fixed across the EPM and rat assays for each cell. The behavioral variables used are listed in the x-axis of (B). Colors indicate consistent cells and projector weights. (B) Weights of CoCA behavioral projector variables for the EPM (top) and rat exposure (bottom) assays showing the relative importance of each variable in each assay. All variables were normalized to unit variance before training and testing, with the exception of |x| and |y|, which were scaled to the range [0, 1]. (C) CoCA neural projection weights normalized to the range [−1, 1], mean ± 1 SEM (data are represented as mean ± SEM; n = 64 open cells, n = 166 neither cells, n = 87 closed cells; U = 8.02, ***p<0.001, Wilcoxon rank sum test, n = 7 mice). (D) (Left) Example correlation of CoCA projection of behavioral data with projection of neural data for testing data (mouse 4, rat exposure). Each point is one timepoint of data. (Right) Correlation values of CoCA projection of behavioral data with projection of neural data for testing data for each mouse in each assay (p<0.05 all trials vs. random weights, see Materials and methods). (E) CoCA projection of neural data in the EPM (top) and rat exposure (bottom) assays for the same mouse. (F) Similar to (E), but as a heatmap using testing data from all mice for EPM (top) and rat exposure (bottom). (G) Projection of testing neural data is correlated with EPM location index (EPM, left) and x position (rat, right) for an example mouse (r = Pearson’s correlation coefficient). Larger EPM location index corresponds to locations more near the extreme end of the open arms. Larger x position values correspond to locations more near the rat. (H) Average correlation of projection of neural data with EPM location index and x position (rat assay) differs significantly from 0 (data are represented as mean ± SEM; n = 7 mice; EPM t = 10.80; rat t = 6.49, ***p<0.001, one-sample t-test).