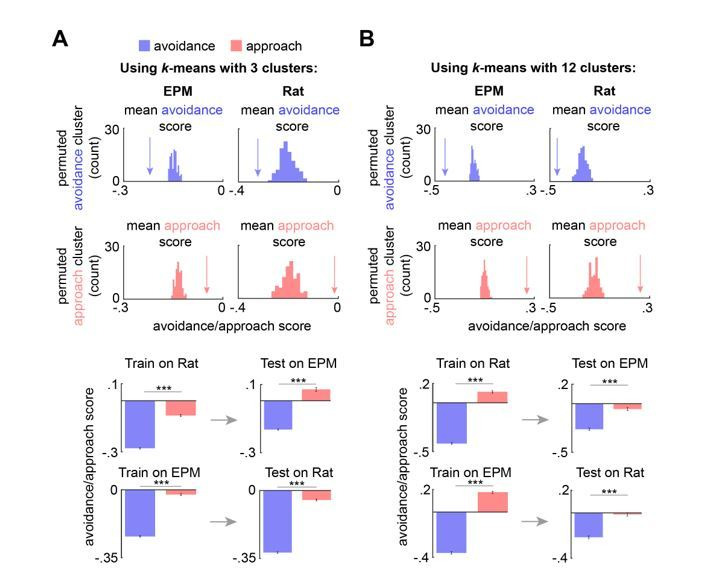
Author response image 1. Approach and avoidance identified by k-means with a range of k values and Hidden Markov Model.

(A) (top) Arrow depicts the mean avoidance/approach score for avoidance and approach clusters (3 clusters), identified by k-means, across concatenated sessions (n = 7 mice). This mean was compared to a permuted distribution of avoidance/approach means, calculated by shuffling the neural data 100 times (n cells same as Figure 4C; p < 0.01). (bottom left) Bars depict the mean Rat and EPM avoidance/approach scores (+/- 1 s.e.m.) for approach and avoidance clusters across mice. (bottom right) As described in Methods and Figure 4B, these cluster centroid locations, trained on one assay, were then used to define approach and avoidance timepoints in the other assay. Bars depict the corresponding mean avoidance/approach score (+/- 1 s.e.m.) for this testing data. (Train on EPM: avoidance cluster n = 17753, approach cluster n= 13096; Test on Rat: avoidance cluster n = 15727, approach cluster n = 7724; Train on Rat: avoidance cluster n = 21092, approach cluster n = 10672; Test on EPM: avoidance cluster n = 9867, approach cluster n = 3028; n cells same as Figure 4D; Wilcoxon ranked-sum test) (B) Same as (A), but with 12 clusters. (Train on EPM: avoidance cluster n = 2614, approach cluster n= 3671; Test on Rat: avoidance cluster n = 1749, approach cluster n = 1488; Train on Rat: avoidance cluster n = 3693, approach cluster n = 2337; Test on EPM: avoidance cluster n = 2163, approach cluster n = 1323; n cells same as Figure 4D; Wilcoxon ranked-sum test) *** p < 0.001.
