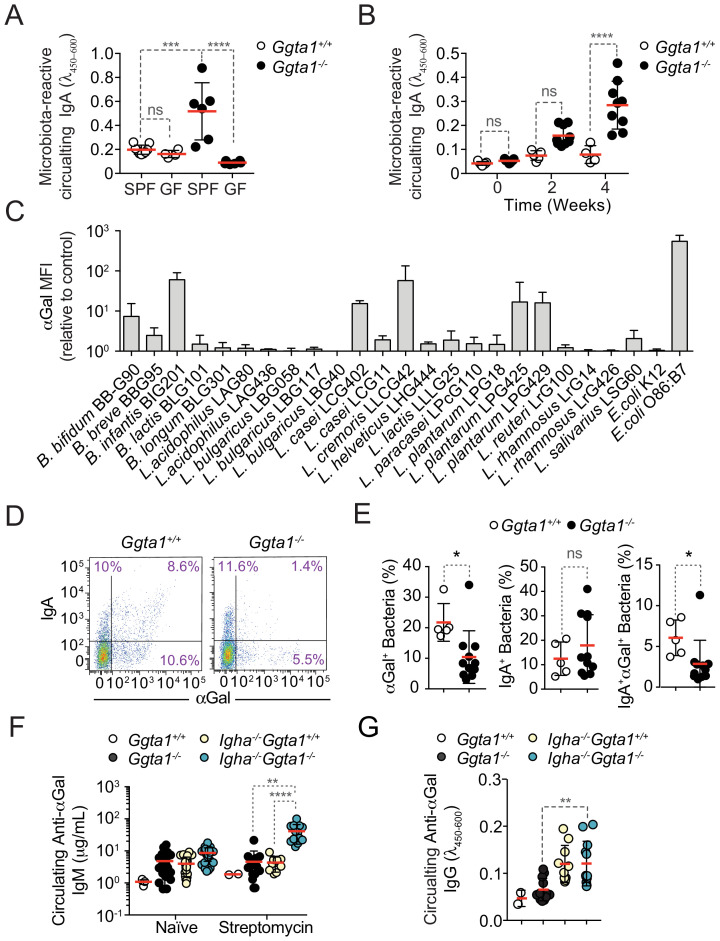
Figure 2. Ggta1 deletion enhances IgA responses to the gut microbiota.
(A) Relative binding of IgA in the serum of Ggta1+/+ (n = 10) and GF Ggta1+/+ (n = 5) mice to fecal extract from Ggta1+/+ mice, and Ggta1-/- (n = 6) and GF Ggta1-/- (n = 6) mice to fecal extract from Ggta1-/- mice; one experiment. (B) Relative binding of IgA in the serum of GF Ggta1+/+ (n = 7) and GF Ggta1-/- (n = 10) mice to cecal extract from Ggta1-/- mice at indicated time-points after colonization with cecal extract from Ggta1-/- mice; two experiments. (C) Median Fluorescence Intensity (MFI) of αGal+ bacterial strains stained with BSI-B4 lectin relative to unstained control; seven experiments. (D) Representative flow cytometry plots showing bacteria stained for IgA and αGal in the small intestinal content of Ggta1+/+ (n = 5) and Ggta1-/- (n = 11) mice; four independent experiments. (E) Quantification of αGal+, IgA+, and IgA+αGal+ bacteria in the same samples as in (D). (F) Concentration of anti-αGal IgM in serum of Ggta1+/+ (n = 2), Ggta1-/- (n = 12), Igha-/-Ggta1+/+ (n = 10), and Igha-/-Ggta1-/- (n = 12) mice before and after streptomycin treatment, two experiments. (G) Concentration of anti-αGal IgG, in the same mice as (F). Symbols (A, B, E, F, G) are individual mice. Red bars (A, B, E, F, G) correspond to mean values. Error bars (A, B, C, E, F, G) correspond to SD. p Values in (A, B, F, G) calculated using Kruskal-Wallis test using Dunn’s multiple comparisons test and in (E) using Mann-Whitney test. *p<0.05, **p<0.01, ***p<0.001, ****p<0.0001, ns: not significant.


