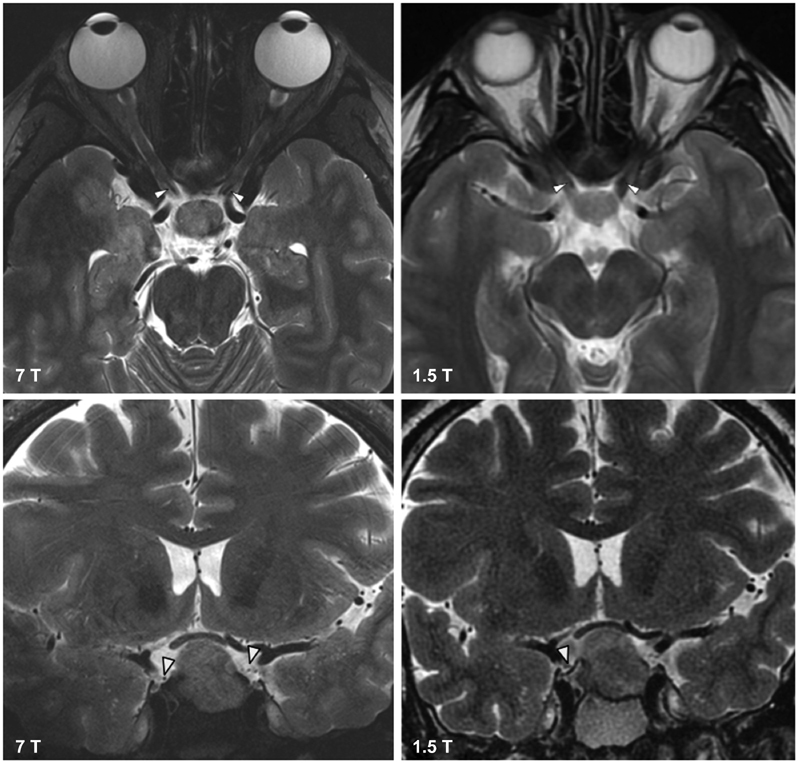
Fig. 3.

The top row shows axial T2-TSE images of the ophthalmic artery at 7 T (left) and 1.5 T (right). The top row shows coronal T2-TSE images of the right posterior communicating artery (PCOM) at 7 T (left). The PCOM is not visible at 1.5 T (right).
