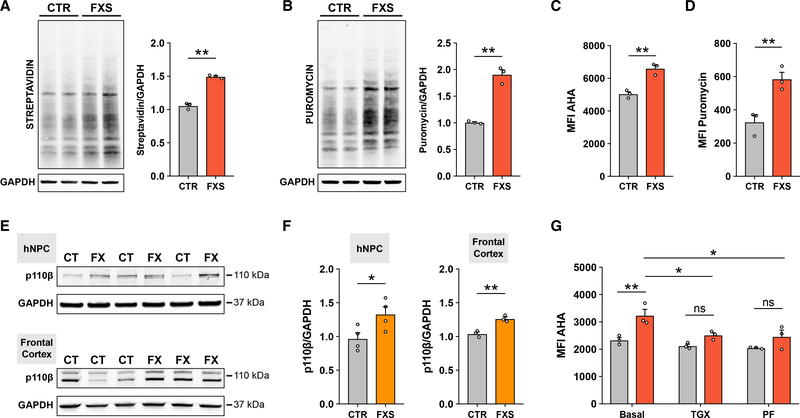
Figure 1. Elevated global protein synthesis in FXS patient-derived NPCs is corrected with inhibition of PI3K signaling.
(A) Representative immunoblot and densitometry analysis showing increased AHA incorporation in FXS NPCs (unpaired t test, **p < 0.01, n = 3 CTR, 3 FXS).
(B) Representative immunoblot and densitometry analysis showing increased puromycin incorporation in FXS NPCs (unpaired t test, **p < 0.01, n = 3 CTR, 3 FXS).
(C) Flow cytometry analysis of AHA incorporation shows increased global protein synthesis in FXS patient NPCs (Mann-Whitney test, **p < 0.01, n = 3 CTR, 3 FXS).
(D) Flow cytometry analysis of puromycin incorporation shows increased global protein synthesis in FXS NPCs (Mann-Whitney test, **p < 0.01, n = 3 CTR, 3 FXS).
(E) Representative immunoblots for p110β and GAPDH in CTR and FXS NPCs and postmortem frontal cortex tissue.
(F) Densitometry analysis of p110β normalized to GAPDH (Mann-Whitney test, *p < 0.05, n = 4 CTR, 4 FXS NPCs; unpaired t test, **p < 0.01, n = 3 CTR, 3 FXS postmortem FC).
(G) Treatment with either p110β inhibitor (TGX) or S6K1 inhibitor (PF) normalizes elevated protein synthesis in FXS patient NPCs (red bars) relative to control NPCs (gray bars) as measured by flow cytometry analysis of AHA incorporation (two-way ANOVA, Tukey’s test, ***adjusted p = 0.0004; n = 3 CTR, 3 FXS NPCs, across two experiments). Each data point represents an average of 2–3 experimental replicates. All data are shown as means ± SEM. MFI, median fluorescent intensity.

