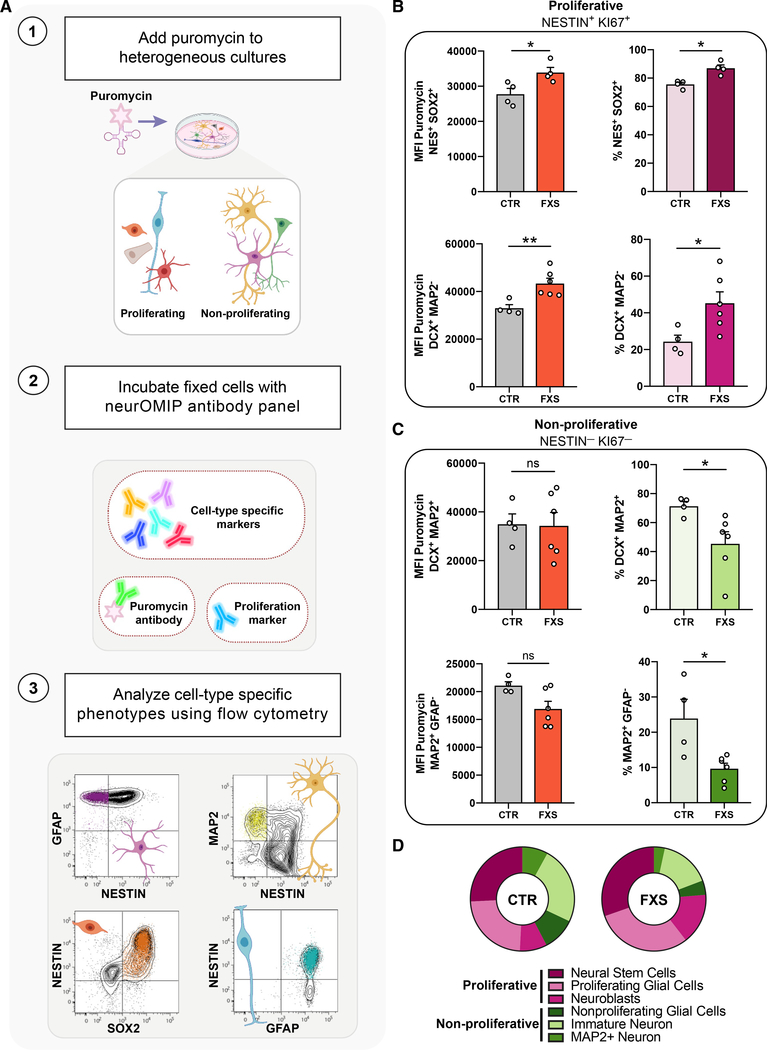
Figure 2. Multiparametric analysis reveals elevated protein synthesis coupled to altered proliferation and neuronal cell fate decisions in FXS patient-derived cells.
(A) Schematic outlining the neuronal optimized multicolor immunophenotyping panel (neurOMIP) assay.
(B) Increased translation within NESTIN+/Ki67+ actively proliferating cells and higher abundance of proliferative cells in FXS cultures compared with that of controls. NESTIN+/SOX2+ cells (top left) and NESTIN+/DCX+ cells (bottom left) showed significantly increased protein synthesis in FXS cultures compared with that of controls. NESTIN+/SOX2+ (top right) and NESTIN+/DCX+ (bottom right) cells both showed increased abundance in FXS cultures.
(C) No significant difference in abundance or protein synthesis in NESTIN-/Ki67- cells between control and FXS cultures. Ki67-/DCX+/MAP2+ cells (top left) and Ki67-/GFAP-/MAP2+ cells (bottom left) showed similar levels of protein synthesis across control and FXS cultures. Ki67-/DCX+/MAP2+ cells (top right) and Ki67-/GFAP-/MAP2+ cells (bottom right) were reduced in FXS cultures. Each subpopulation was analyzed using Mann-Whitney tests, n = 4 CTR, 6 FXS, *p < 0.05, **p < 0.01). Data are shown as means ± SEM.
(D) Summary of abundance of proliferative and non-proliferative populations in CTR versus FXS patient-derived cultures.

