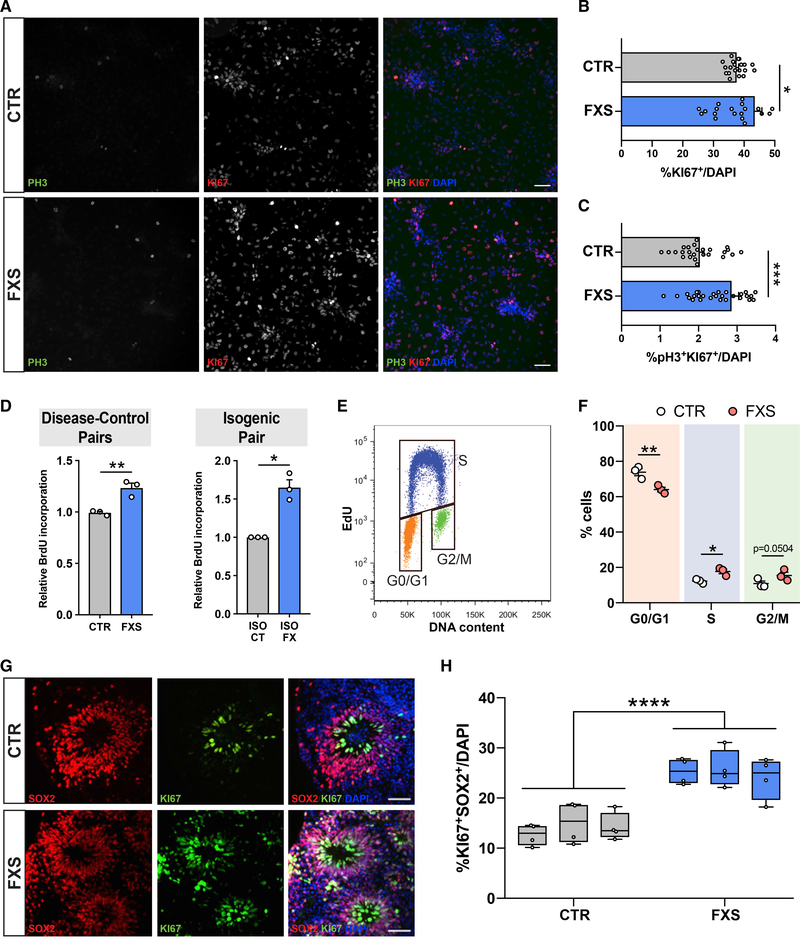
Figure 3. Abnormal proliferation and altered cell-cycle distribution in FXS patient NPCs.
(A) Representative images of CTR and FXS NPCs stained for Ki67, pHH3, and DAPI. Scale bar, 50 μm.
(B and C) High-content image analysis showed FXS patient NPCs have higher mitotic activity as evidenced by more pH3 and Ki67-positive cells normalized to total cells (Mann-Whitney test, **p < 0.01, ***p < 0.001, n = 4 CTR, 4 FXS NPCs, ~3,500 cells imaged per line).
(D and E) Colorimetric ELISA shows greater BrdU incorporation in FXS patient NPCs and a FXS isogenic NPC line compared with controls (Mann-Whitney test, **p < 0.01, n = 3 CTR, 3 FXS NPCs, each data point represents an average of two replicates; unpaired t test, *p < 0.05, n = 3 experiments in isogenic control-disease NPC pair. (E) Representative bivariate dot plot for DNA content (FxCycle) and DNA synthesis (EdU). Gates for cells in G0/G1, S, and G2/M phases are indicated.
(F) Cell cycle distribution of CTR and FXS NPCs after a 30-min EdU pulse demonstrates significant reduction of cells in G0/G1 and an increase of cells in the S phase. (Two-way ANOVA corrected for multiple comparisons using Holm-Sidak method, *adjusted p < 0.05, **adjusted p < 0.01, n = 3 CTR, 3 FXS NPCs.)
(G) Representative images of CTR and FXS 3D organoids stained for proliferative markers Ki67 and SOX2. Scale bar, 50 μm.
(H) Quantification of the proportion of Ki67+SOX2+ cells in CTR and FXS organoids at day 28 shows increased actively proliferating cells in FXS (ANOVA, ***p < 0.001, ANOVA, n = 3 CTR, 3 FXS).

