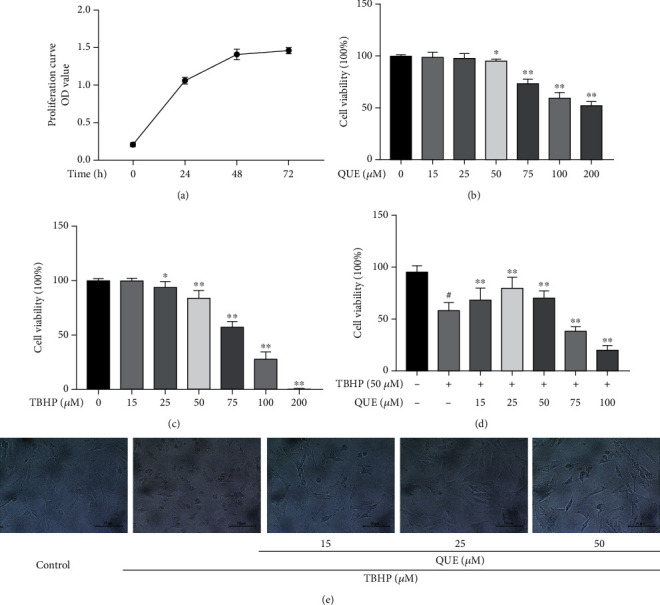
Figure 1.

The effects of QUE and TBHP on NPC viability. (a) Growth curves of NPCs during the first 72 h of culture. (b, c) Viability of NPCs treated with different concentrations of QUE and TBHP for 24 h. (d) Viability of TBHP-induced NPCs pretreated with QUE. (e) Representative images showing morphological changes in NPCs after pretreatment with different concentrations of QUE followed by incubation with 50 μM TBHP (original magnification ×200, scale bar: 50 μm). Data are presented as mean ± standard deviation from three independent experiments. #P < 0.01 vs. control group; ∗P < 0.05 and ∗∗P < 0.01 vs. TBHP-induced group.
