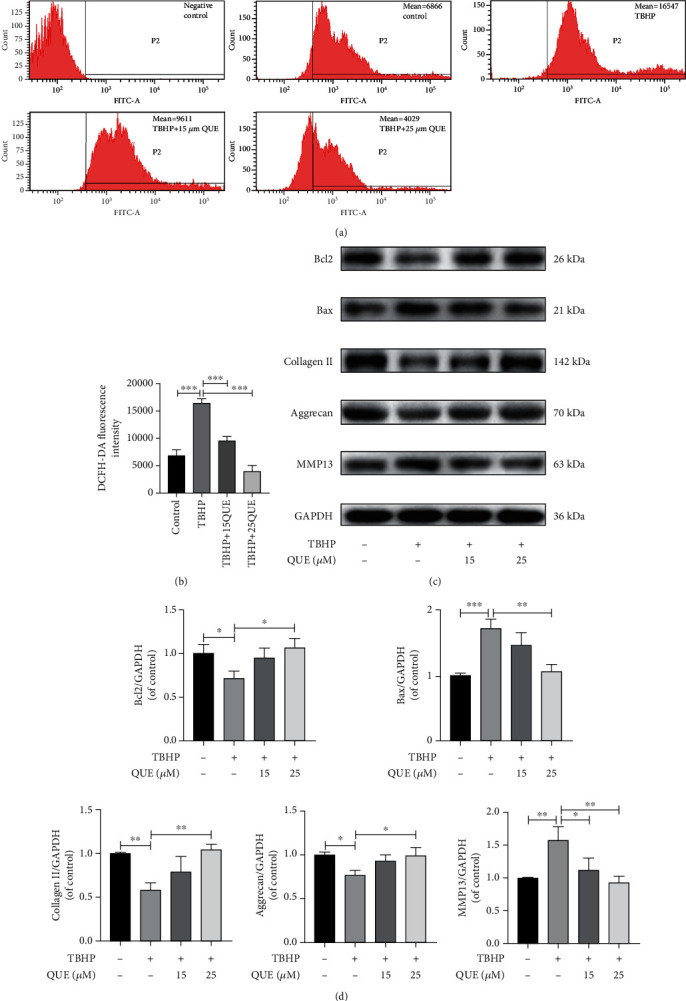
Figure 2.

QUE protects NPCs against TBHP-induced apoptosis and ECM degradation. (a) Measurement of intracellular ROS levels by flow cytometry. (b) Quantification of ROS levels by measuring the DCFH-DA fluorescence intensity in each treatment group. (c) Western blot analysis of the prosurvival protein, Bcl-2, and proapoptotic protein, Bax, and ECM-related proteins, collagen II, ACAN, and MMP13. (d) Quantification of protein levels for Bcl 2, Bax, collagen II, ACAN, and MMP13. Data are presented as the mean ± standard deviation from three independent experiments. ∗P < 0.05; ∗∗P < 0.01; ∗∗∗P < 0.001.
