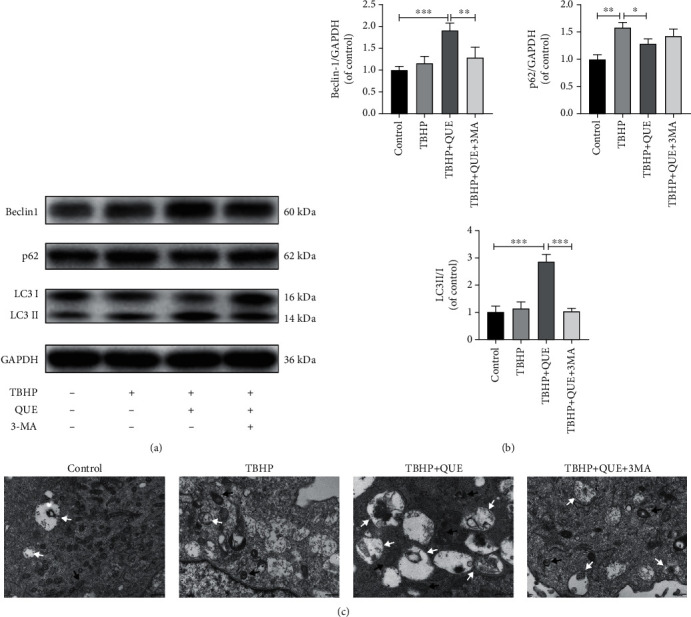
Figure 3.

QUE treatment upregulates autophagy in NPCs. (a) Western blot analysis of the autophagy-related proteins, Beclin-1 and p62, and LC3 II/I. (b) Quantification of Beclin-1, p62, and LC3 II/I protein levels. (c) Representative TEM image showing the autophagic changes in NPCs after various treatments. Black arrow: autophagosome; white arrow: autophagolysosome. Original magnification ×30000, scale bar: 500 nm. Data are presented as mean ± standard deviation from three independent experiments. ∗P < 0.05; ∗∗P < 0.01; ∗∗∗P < 0.001.
